

Genomic dissection of population substructure of Han Chinese and its implication in association studies
- PMID: 19944404
- PMCID: PMC2790582
- DOI: 10.1016/j.ajhg.2009.10.015
Genomic dissection of population substructure of Han Chinese and its implication in association studies
Abstract
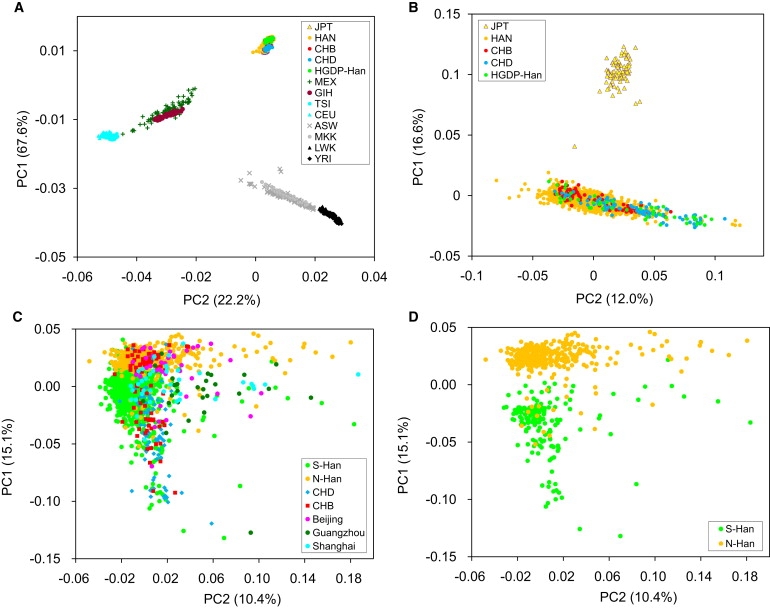
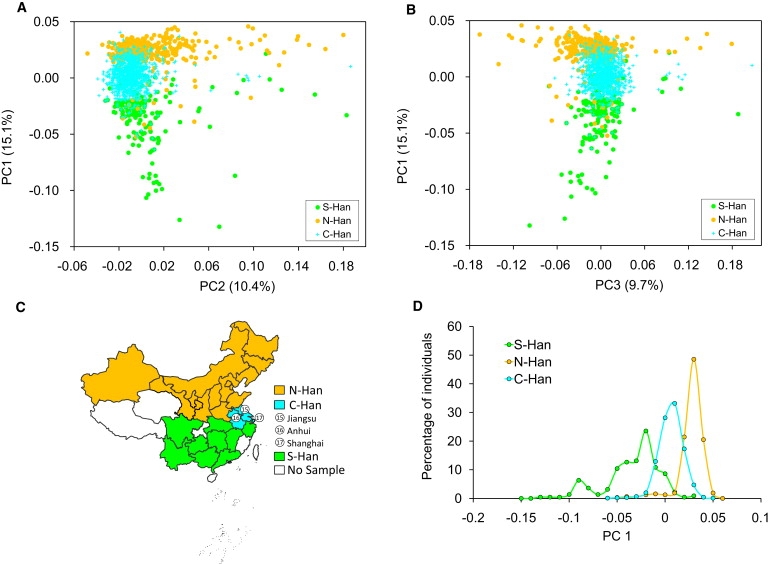
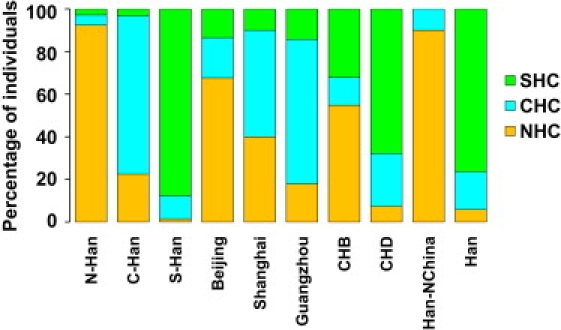
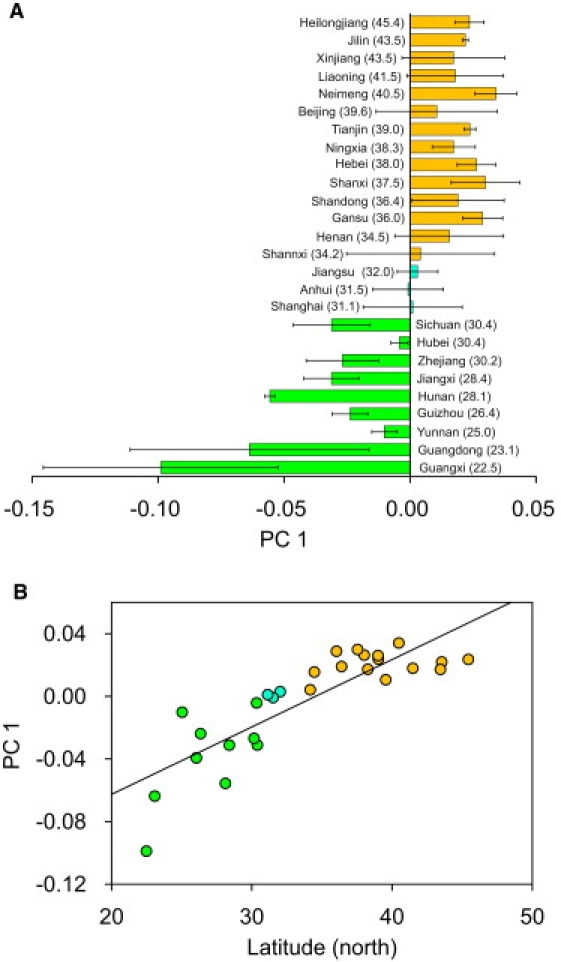
To date, most genome-wide association studies (GWAS) and studies of fine-scale population structure have been conducted primarily on Europeans. Han Chinese, the largest ethnic group in the world, composing 20% of the entire global human population, is largely underrepresented in such studies. A well-recognized challenge is the fact that population structure can cause spurious associations in GWAS. In this study, we examined population substructures in a diverse set of over 1700 Han Chinese samples collected from 26 regions across China, each genotyped at approximately 160K single-nucleotide polymorphisms (SNPs). Our results showed that the Han Chinese population is intricately substructured, with the main observed clusters corresponding roughly to northern Han, central Han, and southern Han. However, simulated case-control studies showed that genetic differentiation among these clusters, although very small (F(ST) = 0.0002 approximately 0.0009), is sufficient to lead to an inflated rate of false-positive results even when the sample size is moderate. The top two SNPs with the greatest frequency differences between the northern Han and southern Han clusters (F(ST) > 0.06) were found in the FADS2 gene, which associates with the fatty acid composition in phospholipids, and in the HLA complex P5 gene (HCP5), which associates with HIV infection, psoriasis, and psoriatic arthritis. Ingenuity Pathway Analysis (IPA) showed that most differentiated genes among clusters are involved in cardiac arteriopathy (p < 10(-101)). These signals indicating significant differences among Han Chinese subpopulations should be carefully explained in case they are also detected in association studies, especially when sample sources are diverse.
Figures
References
-
- Campbell C.D., Ogburn E.L., Lunetta K.L., Lyon H.N., Freedman M.L., Groop L.C., Altshuler D., Ardlie K.G., Hirschhorn J.N. Demonstrating stratification in a European American population. Nat. Genet. 2005;37:868–872. - PubMed
-
- Helgason A., Yngvadottir B., Hrafnkelsson B., Gulcher J., Stefansson K. An Icelandic example of the impact of population structure on association studies. Nat. Genet. 2005;37:90–95. - PubMed
-
- Li J.Z., Absher D.M., Tang H., Southwick A.M., Casto A.M., Ramachandran S., Cann H.M., Barsh G.S., Feldman M., Cavalli-Sforza L.L. Worldwide human relationships inferred from genome-wide patterns of variation. Science. 2008;319:1100–1104. - PubMed
Publication types
MeSH terms
Substances
LinkOut - more resources
Full Text Sources
Other Literature Sources
Research Materials
Miscellaneous
