

Predicting grip force amplitude involves circuits in the anterior basal ganglia
- PMID: 19944767
- PMCID: PMC2818558
- DOI: 10.1016/j.neuroimage.2009.11.047
Predicting grip force amplitude involves circuits in the anterior basal ganglia
Abstract
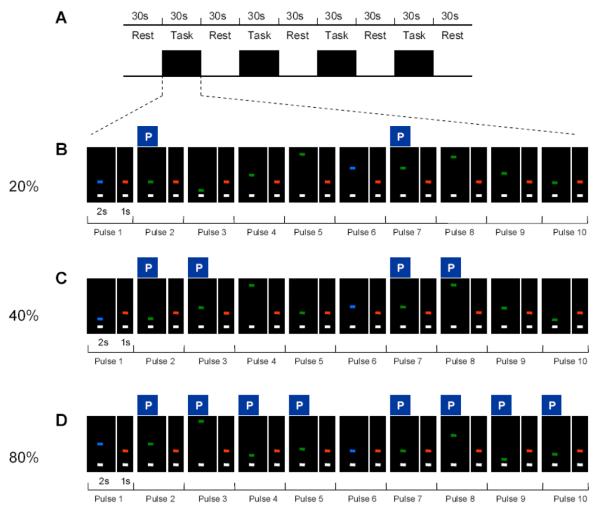
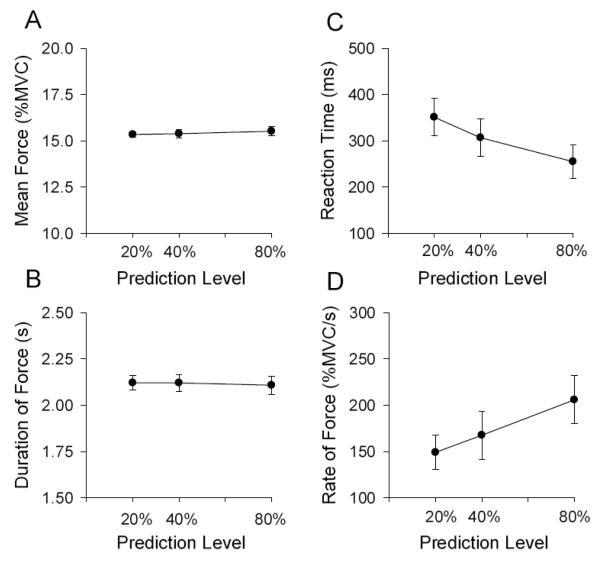
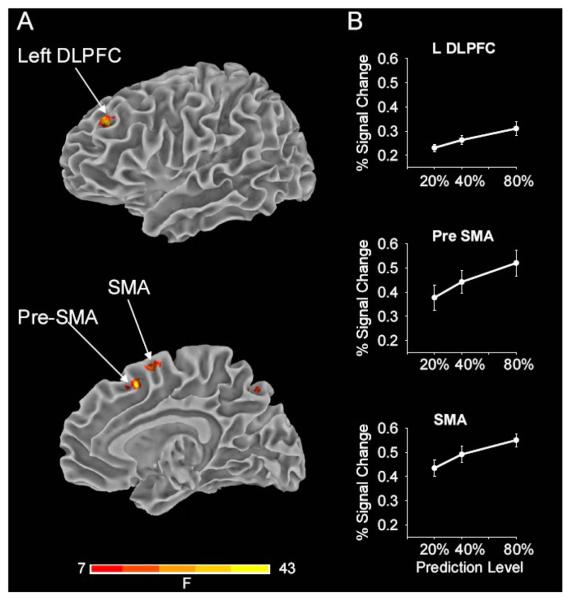
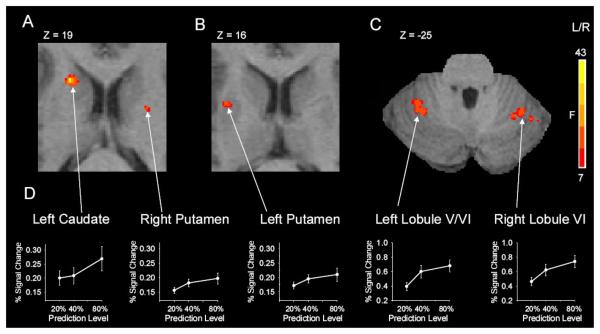
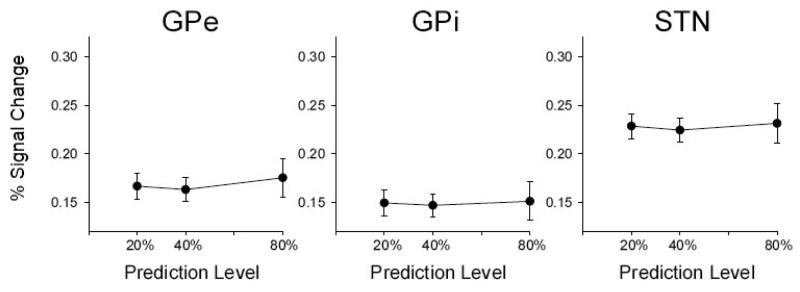
The ability to grip objects allows us to perform many activities of daily living such as eating and drinking. Lesions to and disorders of the basal ganglia can cause deficits in grip force control. Although the prediction of grip force amplitude is an important component of performing a grip force task, the extant literature suggests that this process may not include the basal ganglia. This study used functional magnetic resonance imaging (fMRI) to explore the functional brain mechanisms underlying the prediction of grip force amplitude. The mean force and duration of force did not vary across prediction levels. As anticipated, the reaction time decreased with the level of grip force predictions. In confirmation of previous studies, the parieto-frontal and cerebellar circuits increased their fMRI signal as grip force predictability increased. In addition, the novel finding was that anterior nuclei in the basal ganglia such as caudate and anterior putamen also had an fMRI signal that increased with the level of grip force prediction. In contrast, the fMRI signal in posterior nuclei of the basal ganglia did not change with the level of prediction. These findings provide new evidence indicating that anterior basal ganglia nuclei are involved in the predictive scaling of precision grip force control. Further, the results provide additional support for the planning and parameterization model of the basal ganglia by demonstrating that specific anterior nuclei of the basal ganglia are involved in planning grip force.
Copyright 2009 Elsevier Inc. All rights reserved.
Figures
Similar articles
-
Role of the basal ganglia and frontal cortex in selecting and producing internally guided force pulses.Neuroimage. 2007 Jul 1;36(3):793-803. doi: 10.1016/j.neuroimage.2007.03.002. Epub 2007 Mar 13. Neuroimage. 2007. PMID: 17451971 Free PMC article.
-
Basal ganglia mechanisms underlying precision grip force control.Neurosci Biobehav Rev. 2009 Jun;33(6):900-8. doi: 10.1016/j.neubiorev.2009.03.004. Epub 2009 Mar 14. Neurosci Biobehav Rev. 2009. PMID: 19428499 Free PMC article. Review.
-
Role of individual basal ganglia nuclei in force amplitude generation.J Neurophysiol. 2007 Aug;98(2):821-34. doi: 10.1152/jn.00239.2007. Epub 2007 Jun 13. J Neurophysiol. 2007. PMID: 17567775 Free PMC article.
-
Motor control in basal ganglia circuits using fMRI and brain atlas approaches.Cereb Cortex. 2006 Feb;16(2):149-61. doi: 10.1093/cercor/bhi089. Epub 2005 Apr 27. Cereb Cortex. 2006. PMID: 15858164 Clinical Trial.
-
The centre of the brain: topographical model of motor, cognitive, affective, and somatosensory functions of the basal ganglia.Hum Brain Mapp. 2013 Nov;34(11):3031-54. doi: 10.1002/hbm.22124. Epub 2012 Jun 19. Hum Brain Mapp. 2013. PMID: 22711692 Free PMC article. Review.
Cited by
-
I See Your Effort: Force-Related BOLD Effects in an Extended Action Execution-Observation Network Involving the Cerebellum.Cereb Cortex. 2019 Mar 1;29(3):1351-1368. doi: 10.1093/cercor/bhy322. Cereb Cortex. 2019. PMID: 30615116 Free PMC article.
-
Spatiotemporal tuning of brain activity and force performance.Neuroimage. 2011 Feb 1;54(3):2226-36. doi: 10.1016/j.neuroimage.2010.10.003. Epub 2010 Oct 16. Neuroimage. 2011. PMID: 20937396 Free PMC article.
-
Adaptive grip force is modulated by subthalamic beta activity in Parkinson's disease patients.Neuroimage Clin. 2015 Sep 29;9:450-7. doi: 10.1016/j.nicl.2015.09.010. eCollection 2015. Neuroimage Clin. 2015. PMID: 26594627 Free PMC article.
-
A neurocomputational view of the effects of Parkinson's disease on speech production.Front Hum Neurosci. 2024 May 15;18:1383714. doi: 10.3389/fnhum.2024.1383714. eCollection 2024. Front Hum Neurosci. 2024. PMID: 38812472 Free PMC article.
-
Low-frequency fluctuation in continuous real-time feedback of finger force: a new paradigm for sustained attention.Neurosci Bull. 2012 Aug;28(4):456-67. doi: 10.1007/s12264-012-1254-2. Neurosci Bull. 2012. PMID: 22833043 Free PMC article.
References
-
- Apicella P, Ravel S, Sardo P, Legallet E. Influence of predictive information on responses of tonically active neurons in the monkey striatum. J Neurophysiol. 1998;80:3341–3344. - PubMed
-
- Castiello U. The neuroscience of grasping. Nat Rev Neurosci. 2005;6:726–736. - PubMed
-
- Clower DM, Dum RP, Strick PL. Basal ganglia and cerebellar inputs to ‘AIP’. Cereb Cortex. 2005;15:913–920. - PubMed
-
- Dafotakis M, Sparing R, Eickhoff SB, Fink GR, Nowak DA. On the role of the ventral premotor cortex and anterior intraparietal area for predictive and reactive scaling of grip force. Brain Res. 2008;1228:73–80. - PubMed
-
- Dai TH, Liu JZ, Sahgal V, Brown RW, Yue GH. Relationship between muscle output and functional MRI-measured brain activation. Exp Brain Res. 2001;140:290–300. - PubMed
Publication types
MeSH terms
Grants and funding
LinkOut - more resources
Full Text Sources
Medical
Research Materials
