Functional epileptic network in left mesial temporal lobe epilepsy detected using resting fMRI
- PMID: 19945255
- PMCID: PMC2823966
- DOI: 10.1016/j.eplepsyres.2009.10.018
Functional epileptic network in left mesial temporal lobe epilepsy detected using resting fMRI
Abstract
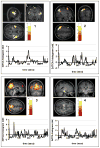
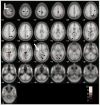
The purpose of this study was to determine transient functional signal activity in a small, homogeneous group of left temporal lobe epilepsy (TLE) patients, without the use of EEG; and to use one of these activated regions to identify a possible epileptogenic network across the whole brain in this group. Resting functional MRI scanning was performed on five left TLE patients who underwent selective amygdalohippocampectomy resulting in seizure control and 10 healthy control subjects. Activation maps of functional signal peaks were calculated using a data-driven analysis, 2dTCA, across the group of patients. In addition to the expected region of activation in the left anterior hippocampus, the results of the 2dTCA analysis revealed activity in the bilateral insular cortex and default-mode network which are not commonly reported using fMRI, but are supported by other electrical and functional changes. The region of activation corresponding to the anterior hippocampal region of resection (presumably the epileptogenic region) was used as a seed region for fMRI functional connectivity analysis. This revealed increased negative connectivity in the patients as compared to controls across a network including thalamic, brainstem, frontal and parietal regions consistent with theories of inhibited function in subcortical and cortical structures during ictal propagation.
Figures


References
-
- Addis DR, Moscovitch M, McAndrews MP. Consequences of hippocampal damage across the autobiographical memory network in left temporal lobe epilepsy. Brain. 2007;130:2327–2342. - PubMed
-
- Aghakhani Y, Kobayashi E, Bagshaw AP, Hawco C, Benar CG, Dubeau F, Gotman J. Cortical and thalamic fMRI responses in partial epilepsy with focal and bilateral synchronous spikes. Clin Neurophysiol. 2006;117:177–191. - PubMed
-
- Arnold S, Schlaug G, Niemann H, Ebner A, Luders H, Witte OW, Seitz RJ. Topography of interictal glucose hypometabolism in unilateral mesiotemporal epilepsy. Neurology. 1996;46:1422–1430. - PubMed
-
- Bertram EH, Mangan PS, Zhang D, Scott CA, Williamson JM. The midline thalamus: alterations and a potential role in limbic epilepsy. Epilepsia. 2001;42:967–978. - PubMed
Publication types
MeSH terms
Grants and funding
LinkOut - more resources
Full Text Sources
Other Literature Sources

