Comparative Study
. 2009 Nov 25;64(4):537-49.
doi: 10.1016/j.neuron.2009.10.005.

Endocannabinoid signaling is required for development and critical period plasticity of the whisker map in somatosensory cortex

Affiliations
Comparative Study

Endocannabinoid signaling is required for development and critical period plasticity of the whisker map in somatosensory cortex

Lu Li et al. Neuron. .

Abstract

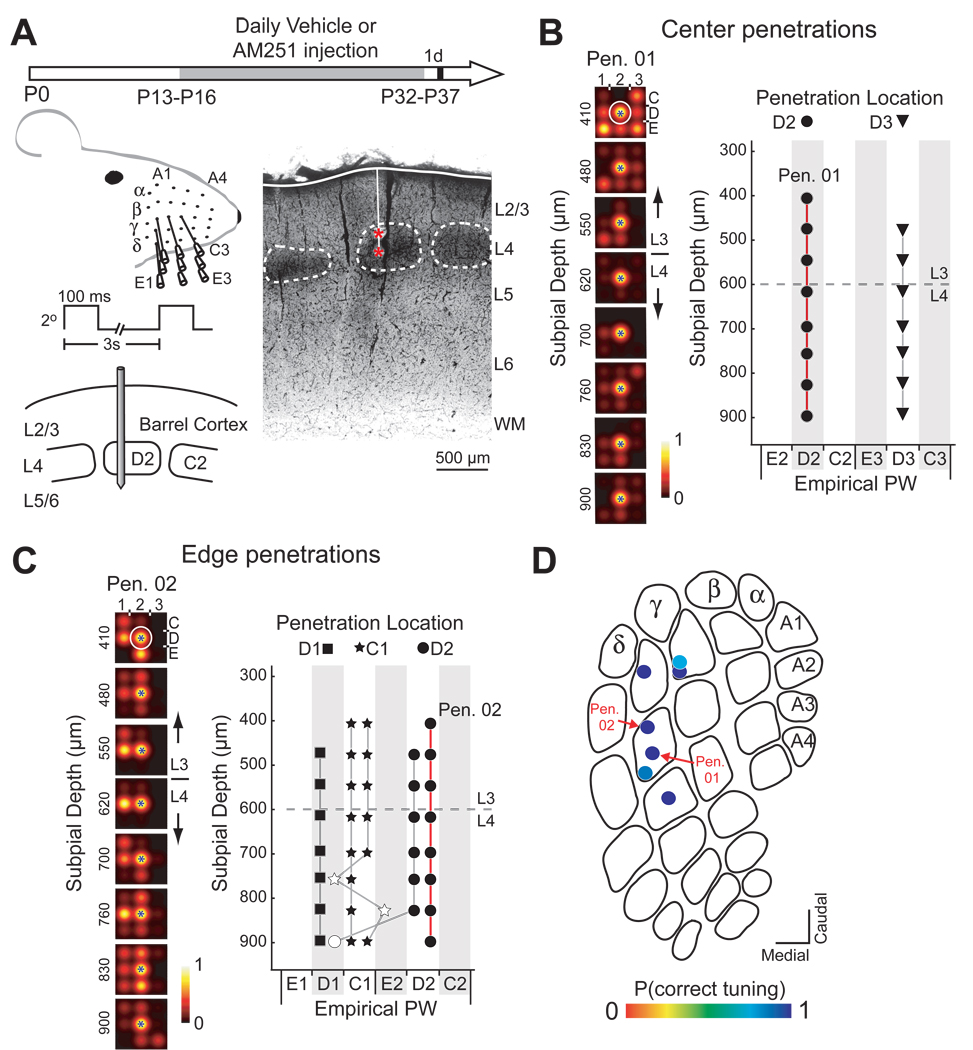
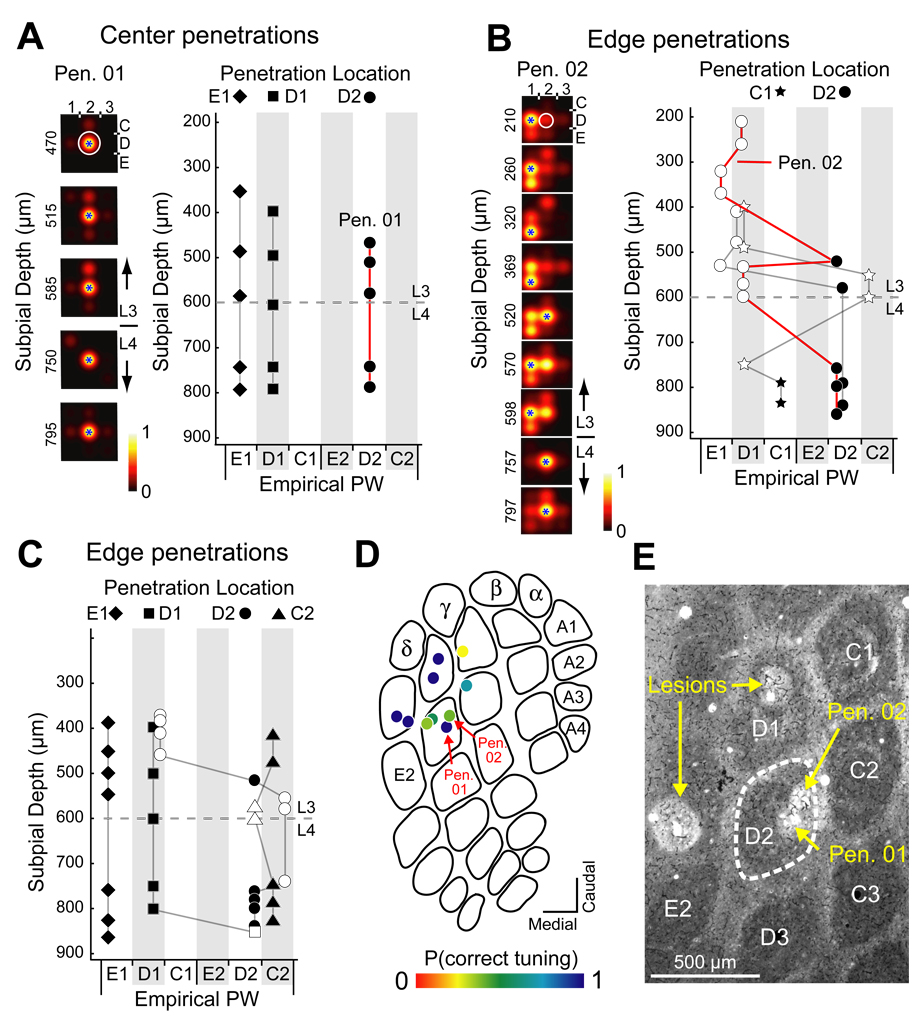
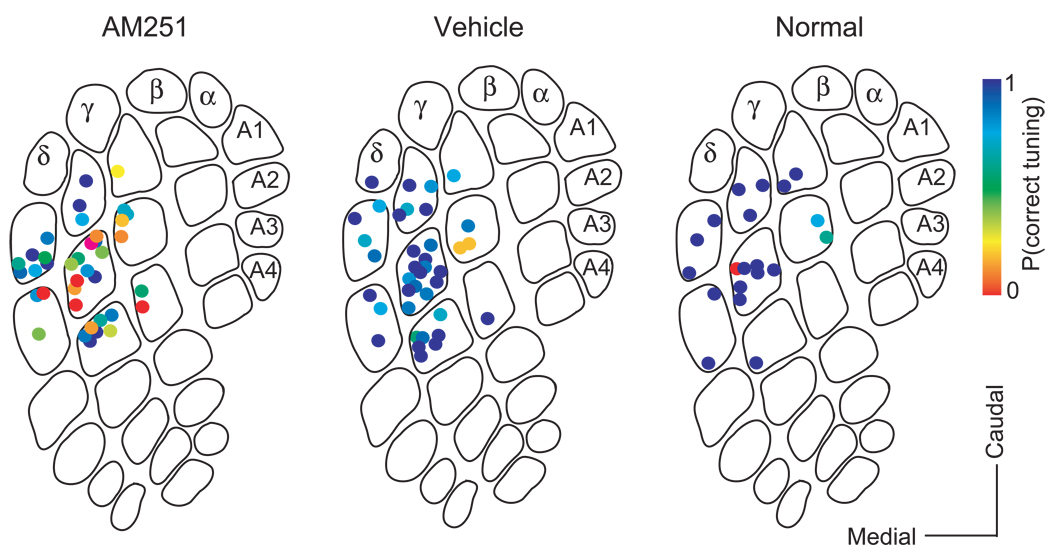
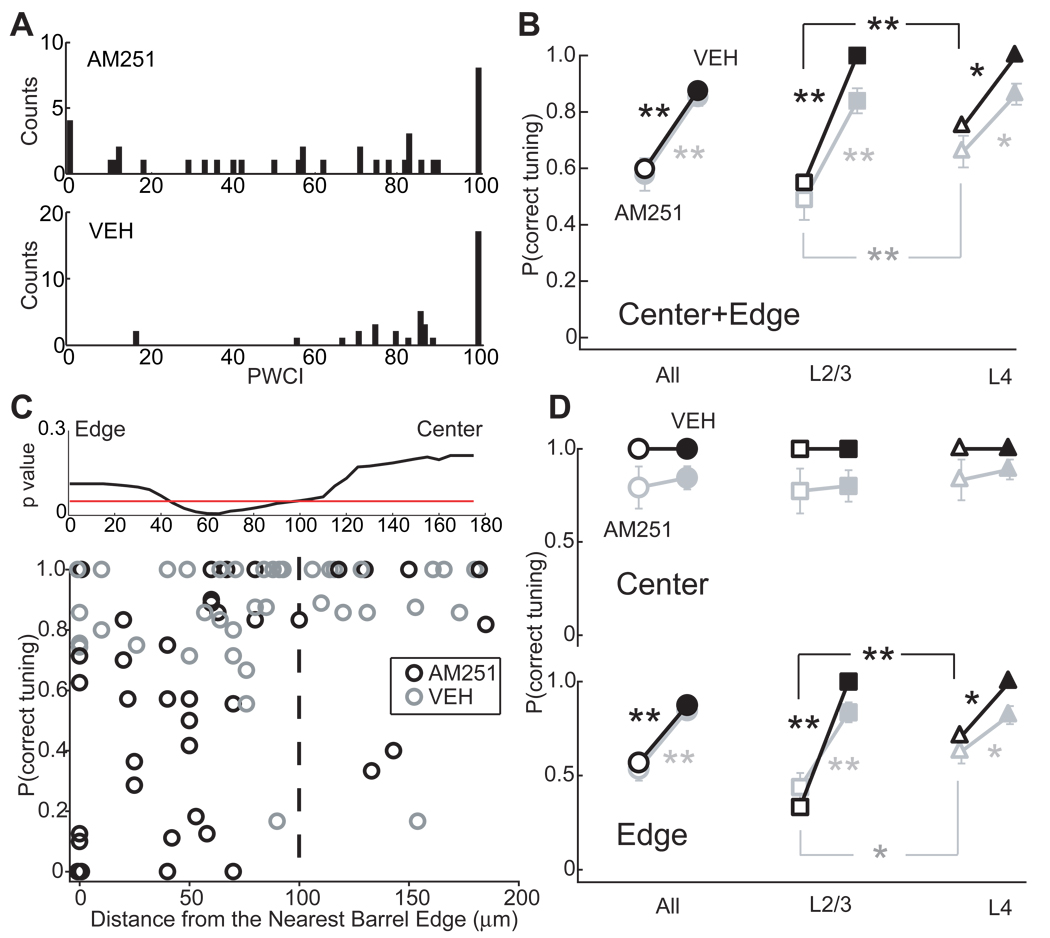
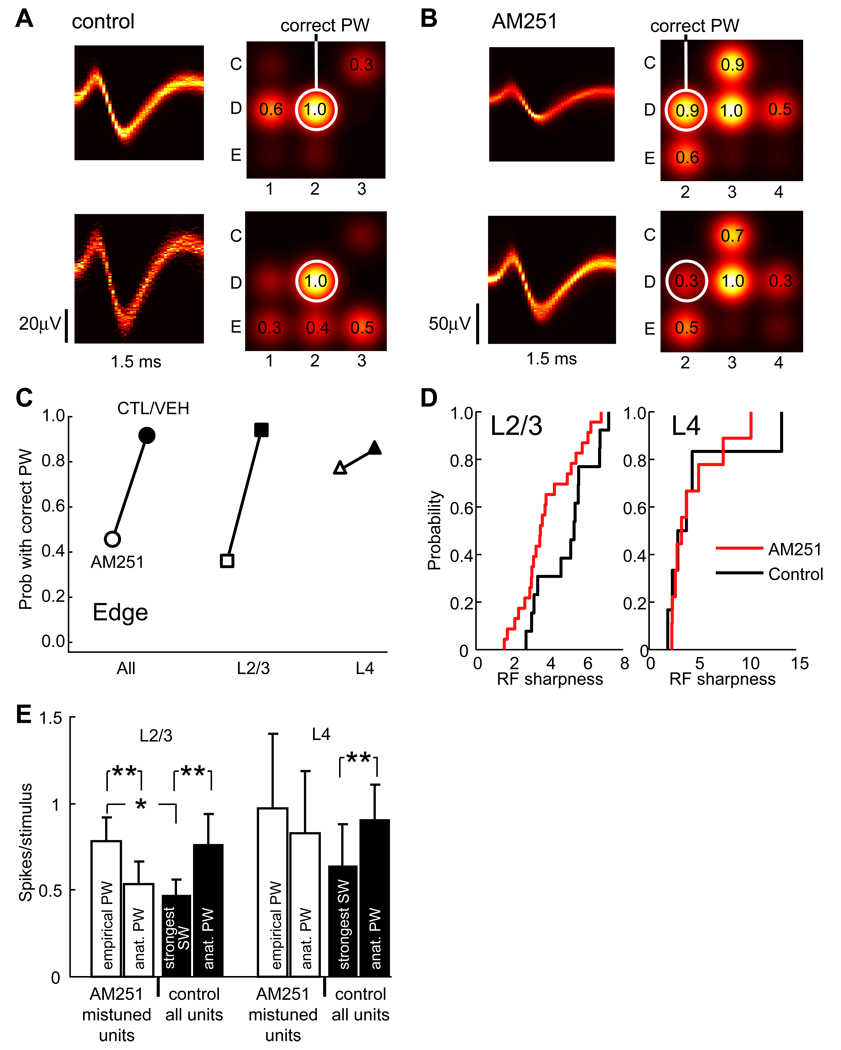
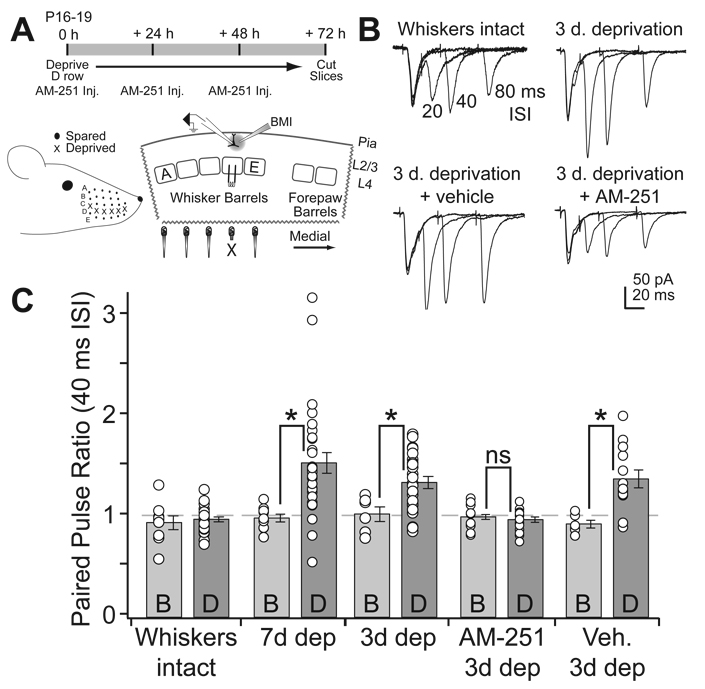
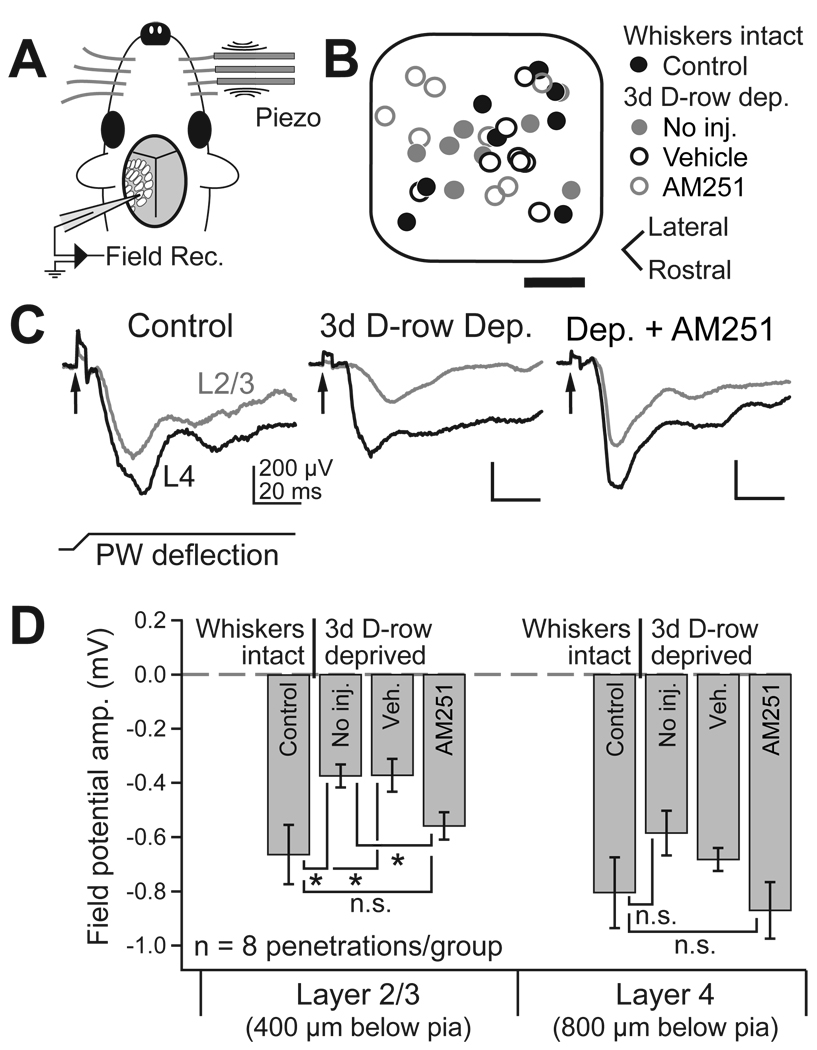
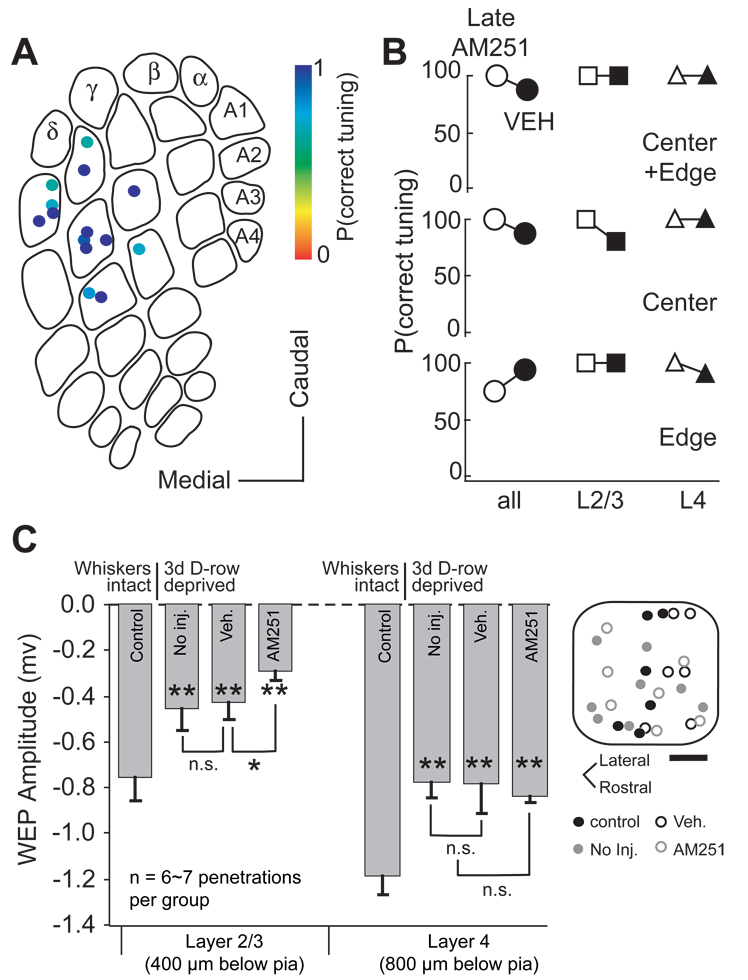
Type 1 cannabinoid (CB1) receptors mediate widespread synaptic plasticity, but how this contributes to systems-level plasticity and development in vivo is unclear. We tested whether CB1 signaling is required for development and plasticity of the whisker map in rat somatosensory cortex. Treatment with the CB1 antagonist AM251 during an early critical period for layer (L) 2/3 development (beginning postnatal day [P] 12-16) disrupted whisker map development, leading to inappropriate whisker tuning in L2/3 column edges and a blurred map. Early AM251 treatment also prevented experience-dependent plasticity in L2/3, including deprivation-induced synapse weakening and weakening of deprived whisker responses. CB1 blockade after P25 did not disrupt map development or plasticity. AM251 had no acute effect on sensory-evoked spiking and only modestly affected field potentials, suggesting that plasticity effects were not secondary to gross activity changes. These findings implicate CB1-dependent plasticity in systems-level development and early postnatal plasticity of the whisker map.


Figures

Figure 1
Figure 1. Whisker map precision in a vehicle-treated rat
(A) Left: Experimental design and electrophysiological recording. Right: Coronal section showing a penetration with two marking lesions (red *). Scale bar: 500 µm. (B) Multiunit receptive fields (RFs) for recording sites along a penetration through the D2 column center (PN01) in rat H46. Circle, anatomically corresponding whisker for the penetration. Blue star, measured empirical PW for each recording site. (C) Empirical PW at all recording sites in 2 center penetrations in H46. Symbol shape denotes recording site location and anatomically appropriate whisker. Filled symbols, correctly tuned sites. Dashed line, L2/3-L4 border. (D) and (E) Tuning curves and PW measured for all 5 edge penetrations in H46. Open symbols denote mistuned sites. (F) P(correct tuning) for all penetrations in H46, plotted on an exemplar barrel map.
Figure 2
Figure 2. Disrupted whisker map in an AM251-treated rat
(A) Multi-unit whisker RFs for recording sites on a penetration through the D2 column center (Pen. 01) in AM251-treated rat H08. Circle, anatomically corresponding whisker for the penetration. Blue star, measured empirical PW for each recording site. (B) Empirical PW for recording sites in all 3 center penetrations in H08. (C) Whisker receptive fields recorded along a penetration through the D2 column edge (Pen. 02), showing many mistuned sites. (D) and (E) Empirical PW in all 7 edge penetrations in H08, showing disruption of whisker map topography. Open symbols, mistuned sites. Filled symbols, correctly tuned sites. (F) P(correct tuning) for all penetrations in H08. (G) Cytochrome oxidase-stained section showing marking lesions for Pen. 01 and Pen. 02 (arrows). D2 barrel is outlined.
Figure 3
Figure 3. Whisker map precision across conditions
P(correct tuning) for all penetrations in the AM251 group (38 penetrations), vehicle control group (38 penetrations) and normal control group (20 penetrations).
Figure 4
Figure 4. Quantification of laminar and sub-columnar topography of map disruption
(A) Distribution of P(correct tuning) in AM251 and vehicle control groups. (B) Median (black) and mean (gray) P(correct tuning) for the AM251 group (open symbols) and vehicle control group (filled symbols). For this and all figures, * p < 0.05, ** p < 0.01, Error bar: SEM. (C) Selective disruption at column edges. Bottom: P(correct tuning) for each penetration in AM251 (n = 38, black) and vehicle control groups (n = 38, gray) as a function of distance to the closest barrel boundary. Dashed line, center/edge border. Top: Results of sliding Wilcoxon test to identify the boundary between high- and low-P(correct tuning) regions in AM251 penetrations, data were smoothed. Red line, p = 0.05. (D) Median (black) and mean (gray) P(correct tuning) for penetrations in barrel centers and edges. Conventions as in (B).
Figure 5
Figure 5. Disruption of single-unit receptive fields in column edges
(A) Whisker receptive fields for 2 single units in L2/3 of the D2 column edge, in a control rat. Left, density plot of spike waveform. Right, whisker receptive field (as in Fig. 1, Fig. 2), with circle marking the anatomically corresponding whisker (D2) and numbers showing response strength relative to the empirical PW. (B) Whisker receptive fields for 2 single units in L2/3 of the D2 column edge in a rat treated with AM251. These units were mistuned to the D3 whisker. (C) P(correct tuning) for all single units recorded in column edges, for AM251 animals (open) and combined control and vehicle animals (filled). (D) Cumulative distribution of receptive field sharpness. AM251 significantly broadened receptive fields in L2/3, but not L4. (E) Response magnitude (spikes per whisker deflection) for mistuned units in the AM251 group vs. normally tuned units in the combined control/vehicle group. In mistuned units, responses to the anatomical appropriate whisker were similar to those in control units, but responses to the empirical PW were significantly stronger than responses of control cells to the strongest surround whisker.
Figure 6
Figure 6. AM251 blocks deprivation-induced changes of paired pulse ratio at L4-L2/3 synapses
(A) Top, deprivation and drug administration timeline. Bottom, D-row whisker deprivation and positioning of stimulating and recording electrodes in the S1 brain slice. X denotes the deprived D whisker column. (B) Representative paired pulse recordings at the L4-L2/3 synapse in the D column of a control rat (“whiskers intact”), a D-row deprived rat, a D-row deprived rat that received daily vehicle injections, and a D-row deprived rat that received daily AM251 injections. Paired pulse intervals were 20, 40, and 80 ms (plotted superimposed). (C) Mean PPR at 40 ms ISI across the different experimental groups, showing results from deprived D and spared B columns within each slice. 7 d deprivation data are reprinted from Bender et al. (2006a).
Figure 7
Figure 7. AM251 prevents the weakening of deprived whisker response in vivo
(A) Whisker-evoked field potential (WEP) recording methods. (B) Location of all WEP recordings, relative to normalized barrel boundaries. Scale bar, 100 µm. (C) Representative WEPs in L2/3 (grey) and L4 (black) in a control rat, a D-row deprived rat, and a D-row deprived rat that received daily AM251 injection. PW: principal whisker. Arrow, artifact marking time of whisker deflection. (D) Mean WEP amplitude for all deprivation and drug conditions.
Figure 8
Figure 8. Critical period for eCB signaling
(A) P(correct tuning) for all penetrations in rats receiving daily AM251 (5 mg/kg) from P26–30 to P32 – 36 (Late AM251 group). (B). Median P(correct tuning) for LateAM251 group (open) and vehicle control group (filled), for edge and center penetrations, and for L2/3 vs. L4 recording sites. No significant whisker map disruption was evident. (C) Plasticity induced by D-row deprivation from P33 to 36. Bars show mean amplitude of WEPs recorded in L2/3 and L4 in control rats, D-row deprived rats, D-row deprived rats that received daily vehicle injection, and D-row deprived rats that received daily AM251 injection. AM251 did not prevent deprivation-induced weakening of WEPs in these older animals.

References

    1. Allen CB, Celikel T, Feldman DE. Long-term depression induced by sensory deprivation during cortical map plasticity in vivo. Nat Neurosci. 2003;6:291–299. - PubMed
    1. Alloway KD. Information Processing Streams in Rodent Barrel Cortex: The Differential Functions of Barrel and Septal Circuits. Cereb. Cortex. 2008;18:979–989. - PubMed
    1. Armstrong-James M, Fox K. Spatiotemporal convergence and divergence in the rat S1 "barrel" cortex. J. Comp. Neurol. 1987;263:265–281. - PubMed
    1. Armstrong-James M, Welker E, Callahan CA. The contribution of NMDA and non-NMDA receptors to fast and slow transmission of sensory information in the rat SI barrel cortex. J. Neurosci. 1993;13:2149–2160. - PMC - PubMed
    1. Bender KJ, Rangel J, Feldman DE. Development of Columnar Topography in the Excitatory Layer 4 to Layer 2/3 Projection in Rat Barrel Cortex. J. Neurosci. 2003;23:8759–8770. - PMC - PubMed

Publication types

Substances

LinkOut - more resources