. 2010 Feb 15;49(4):3039-46.
doi: 10.1016/j.neuroimage.2009.11.050. Epub 2009 Nov 26.

Functional near infrared spectroscopy (NIRS) signal improvement based on negative correlation between oxygenated and deoxygenated hemoglobin dynamics

Affiliations

Functional near infrared spectroscopy (NIRS) signal improvement based on negative correlation between oxygenated and deoxygenated hemoglobin dynamics

Xu Cui et al. Neuroimage. .

Abstract

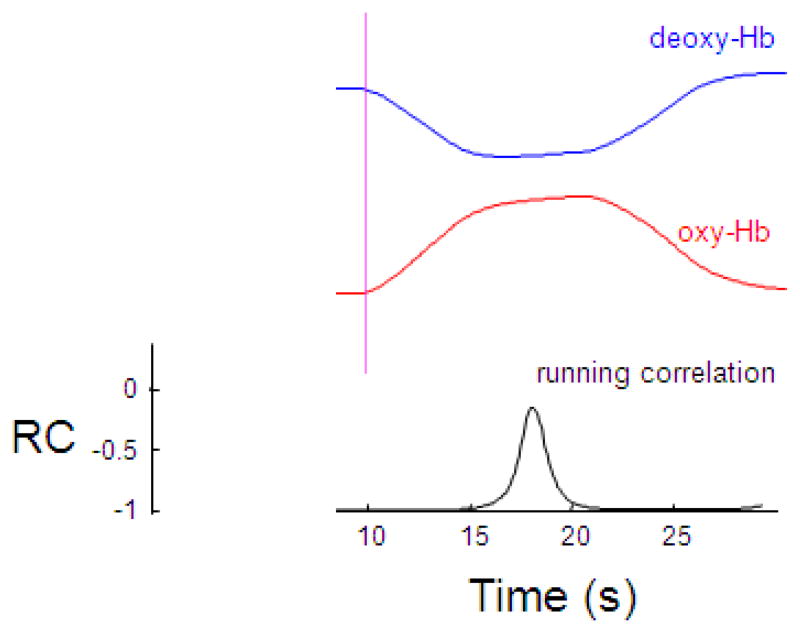
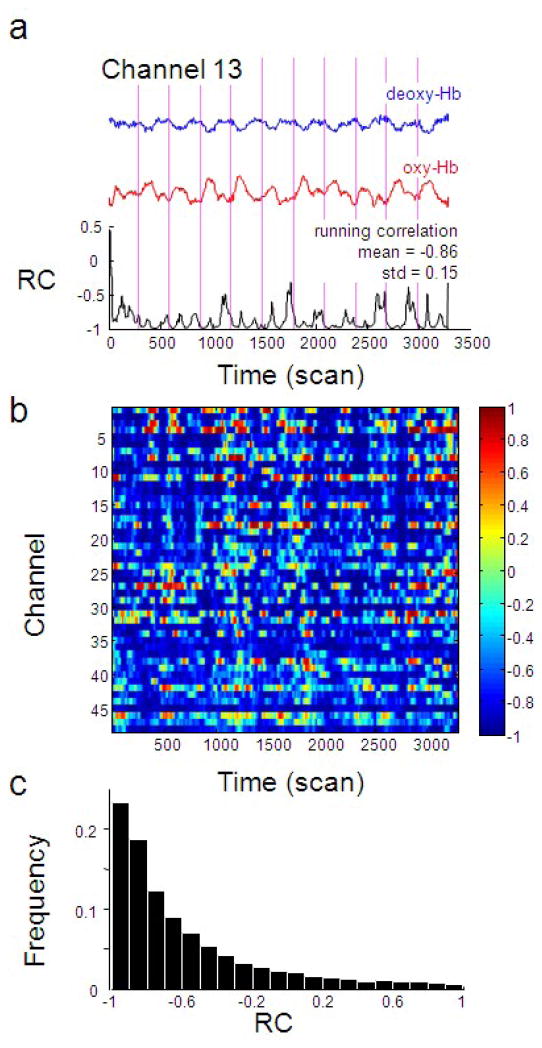
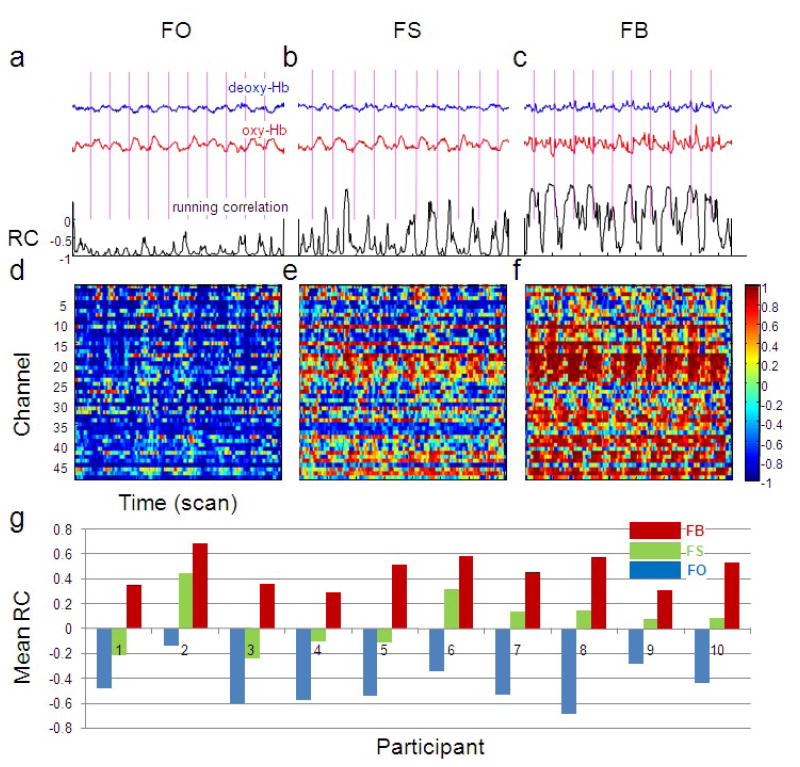
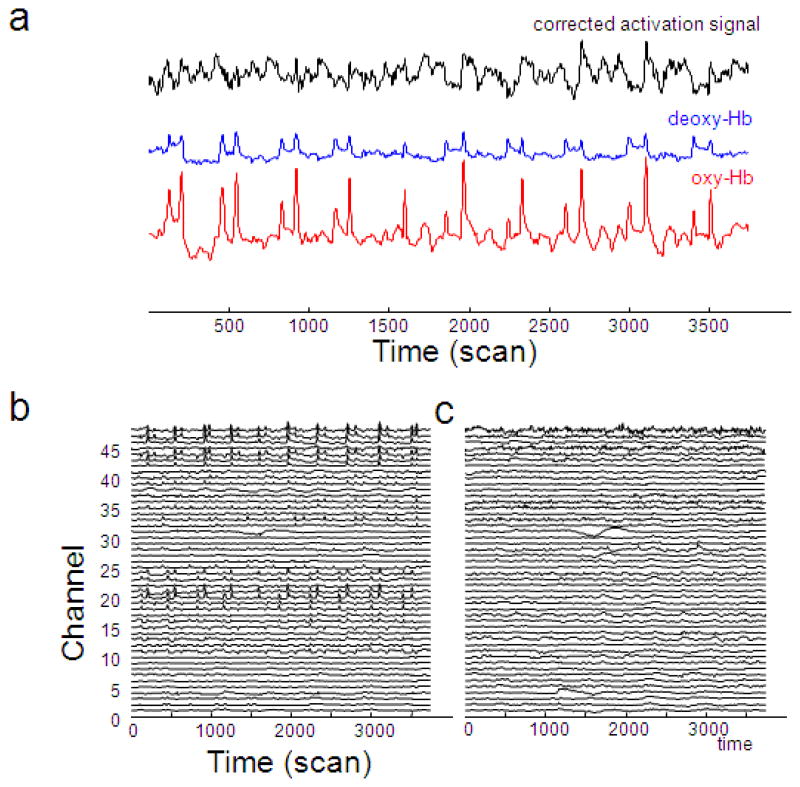
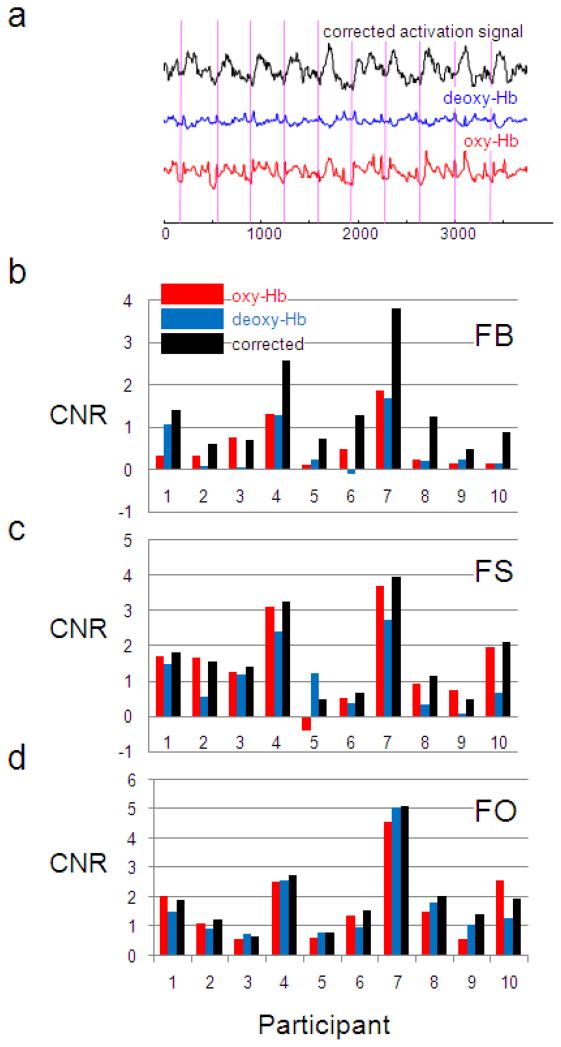
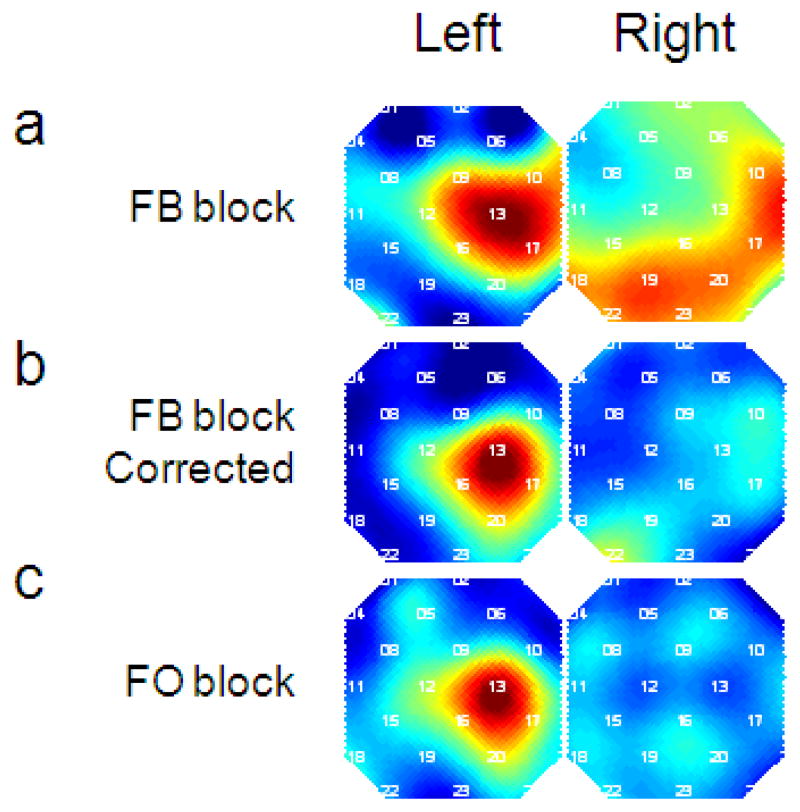
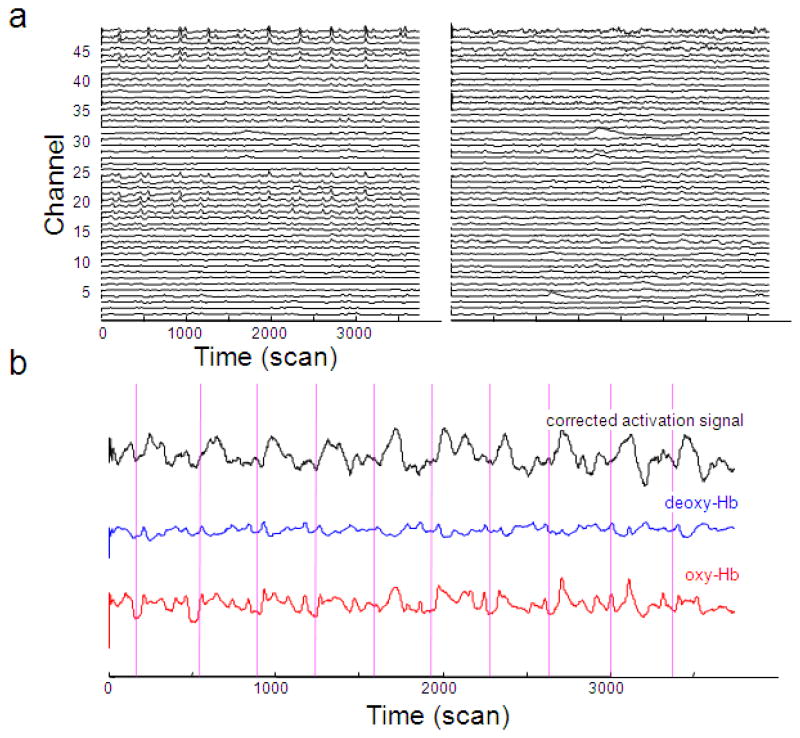
Near infrared spectroscopy (NIRS) is a promising technology for functional brain imaging which measures hemodynamic signals from the cortex, similar to functional magnetic resonance imaging (fMRI), but does not require the participant to lie motionless in a confined space. NIRS can therefore be used for more naturalistic experiments, including face to face communication, or natural body movements, and is well suited for real-time applications that may require lengthy training. However, improving signal quality and reducing noise, especially noise induced by head motion, is challenging, particularly for real time applications. Here we study the properties of head motion induced noise, and find that motion noise causes the measured oxygenated and deoxygenated hemoglobin signals, which are typically strongly negatively correlated, to become more positively correlated. Next, we develop a method to reduce noise based on the principle that the concentration changes of oxygenated and deoxygenated hemoglobin should be negatively correlated. We show that despite its simplicity, this method is effective in reducing noise and improving signal quality, for both online and offline noise reduction.


Figures

Figure 1
Figure 1
Oxy-Hb and deoxy-Hb are negatively correlated during neural activation simulated using the Balloon model. Following onset of finger tapping, oxy-Hb (red) increases and deoxy-Hb (blue) decreases. The running correlation (RC) between oxy-Hb and deoxy-Hb is close to −1 but increases when oxy-Hb and deoxy-Hb plateau. The vertical line indicates the onset of finger tapping.
Figure 2
Figure 2
Oxy-Hb and deoxy-Hb are negatively correlated during finger tapping without head motion. (a) Time series of oxy-Hb (red), deoxy-Hb (blue) and their running correlation (black) from a representative channel (channel 13 which corresponds to the left motor cortex) from a single participant (subject 4). The vertical dotted line indicates the onset of finger tapping. It can be seen that RC is usually less than −0.5 and often close to −1. (b) Running correlation of all channels in the same single subject. Each row represents one channel and each column is a data point (10 data points corresponds to 1s). It can be seen that RC (represented by the color scale on the right) is largely negative across all channels (mean −0.57, standard deviation 0.43). (c) The histogram of the distribution of RCs from panel (b) shows the distribution of the running correlation measured above.
Figure 3
Figure 3
Head motion induced noise makes the correlation between oxy-Hb and deoxy-Hb higher (less negative). (a), (b) and (c) show the running correlation (black), oxy-Hb (red) and deoxy-Hb (blue) in finger tapping only block (FO), finger tapping with small head motion block (FS), finger tapping with big head motion block (FB), respectively, in channel 13 of subject 4. All time series are on the same scale. The mean RCs are −0.86, −0.62 and 0.10 in the three blocks, respectively. (d), (e) and (f) show the running correlation of subject 4 in the three blocks for all channels. (g) The mean running correlations across channels are shown for all participants in all blocks. The mean increase of running correlation from the FO to FS block is 0.52 (paired T test, df=9, p=3×10⁻⁶) across subjects; the increase from the FO to FB block is 0.97 (p=2×10⁻⁸).
Figure 4
Figure 4
The CBSI method effectively removes spikes induced by head motion. (a) The original oxy-Hb (red), the original deoxy-Hb (blue), and corrected activation signal (black) from a single channel (channel 24) of subject 4 in block FB. Spikes induced by head motion which are visually evident in both oxy-Hb and deoxy-Hb are largely removed. The original oxy-Hb signal (b) and the corrected activation signal (c) from all channels of subject 4. Each trace is from a single channel. Most spikes are removed by this method.
Figure 5
Figure 5
The CBSI method improves the contrast to noise ratio (CNR). (a) Time series of oxy-Hb (red), deoxy-Hb (blue) and corrected activation signal (black) from channel 13 of subject 4 in the FB block are shown. Vertical lines indicate the onset of finger tapping. Visually, the corrected signal is more correlated to finger tapping than the original signals. (b) CNR of oxy-Hb and deoxy-Hb before and after correction for all subjects in the FB block. Oxy-Hb CNR is improved in 9 of the 10 subjects. The mean improvement is 0.80. Deoxy-Hb CNR is improved for all subjects (mean improvement 0.89). (c) For comparison, CNR before and after correction are plotted in FS and (d) FO blocks. For oxy-Hb, the mean improvement is 0.17 (FS) and 0.21 (FO), both not significant at p=0.05; for deoxy-Hb, the mean improvement is 0.59 (FS) and 0.28 (FO), both are significant (p=3×10⁻³ and 7×10⁻³, respectively). This smaller CNR improvement in the FO and FS blocks is expected because there is less noise in the original data for this method to remove.
Figure 6
Figure 6
CBSI method improves the spatial signal quality. (a) CNR map of original oxy-Hb of subject 4 in the FB block. We see that while the contrast correctly localized left motor cortex, the activation is diffuse. (b) CNR map of corrected activation signal for subject 4 in the FB block. Compared to the uncorrected map, the corrected map is much more localized and similar to the map in the FO block (c). The CNR maps are normalized to the maximum and minimum across all channels within each map. Numbers in white indicate the channel number. The spatial maps are smoothed using spline interpolation.
Figure 7
Figure 7
The CBSI method improves signal quality in real time. (a) The CBSI method removes spikes from the signal (all channels in subject 4). The left panel shows the original oxy-Hb time series and the right panel shows the corrected activation signal. (b) The CBSI method improves signal quality in channel 13 (left motor cortex) in subject 4. The corrected activation signal is more strongly correlated with finger tapping then the original oxy-Hb. Vertical lines indicate the onset of finger tapping blocks.

Similar articles

Cited by

References

    1. Abdelnour A, Huppert T. Real-time imaging of human brain function by near-infrared spectroscopy using an adaptive general linear model. NeuroImage. 2009;46:133–143. - PMC - PubMed
    1. Bauernfeind G, Leeb R, Wriessnegger SC, Pfurtscheller G. Development, set-up and first results for a one-channel near-infrared spectroscopy system. Biomedizinische Technik. Biomedical engineering. 2008;53:36–43. - PubMed
    1. Boas DA, Strangman G, Culver JP, Hoge RD, Jasdzewski G, Poldrack RA, Rosen BR, Mandeville JB. Can the cerebral metabolic rate of oxygen be estimated with near-infrared spectroscopy? Physics in medicine and biology. 2003;48:2405–18. - PubMed
    1. Buxton RB, Uludag K, Dubowitz DJ, Liu TT. Modeling the hemodynamic response to brain activation. Neuroimage. 2004;23(Suppl 1):S220–33. - PubMed
    1. Buxton RB, Wong EC, Frank LR. Dynamics of blood flow and oxygenation changes during brain activation: the balloon model. Magnetic resonance in medicine. 1998;39:855–64. - PubMed

Publication types