. 2009 Dec;15(12):2129-46.
doi: 10.1261/rna.1912509.

A class I ligase ribozyme with reduced Mg2+ dependence: Selection, sequence analysis, and identification of functional tertiary interactions

Affiliations

A class I ligase ribozyme with reduced Mg2+ dependence: Selection, sequence analysis, and identification of functional tertiary interactions

Sarah C Bagby et al. RNA. 2009 Dec.

Abstract

The class I ligase was among the first ribozymes to have been isolated from random sequences and represents the catalytic core of several RNA-directed RNA polymerase ribozymes. The ligase is also notable for its catalytic efficiency and structural complexity. Here, we report an improved version of this ribozyme, arising from selection that targeted the kinetics of the chemical step. Compared with the parent ribozyme, the improved ligase achieves a modest increase in rate enhancement under the selective conditions and shows a sharp reduction in [Mg(2+)] dependence. Analysis of the sequences and kinetics of successful clones suggests which mutations play the greatest part in these improvements. Moreover, backbone and nucleobase interference maps of the parent and improved ligase ribozymes complement the newly solved crystal structure of the improved ligase to identify the functionally significant interactions underlying the catalytic ability and structural complexity of the ligase ribozyme.


Figures
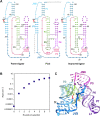
FIGURE 1.
FIGURE 1.
(A) Secondary structures of the parent ligase, the pool of sequences used for selection, and the improved ligase (clone 23). Secondary structural elements (common to all three) are labeled on the pool. Joining regions (J) are named for the two paired regions (P) they connect. Residue numbering is with respect to the ligation junction, with the 5′-terminal residue of ribozyme assigned +1, and the 3′-terminal residue of the substrate assigned –1. All numbering is with reference to the improved ligase; insertions are marked with asterisks. Positions that were randomized in the pool are labeled N on the pool secondary structure; positions mutagenized at the 10% level are shown in lowercase. Sequences in gray on the pool secondary structure are, at left, the DNA portion of the substrate used for selection and, at top, the RT primer-binding site. (B) Improvement of pool activity over the course of the seven rounds of selection. Rates were measured at pH 6.0 in 10 mM Mg2+. (C) Crystal structure of the product of the improved ligase (Shechner et al. 2009). Elements of secondary structure are colored as in A.
FIGURE 2.
FIGURE 2.
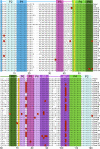
Alignment of the 35 isolated variants. Helix P1 is formed when the substrate oligonucleotide hybridizes to nucleotides 13–18. Red blocks highlight nonparental nucleotides in regions that were not fully randomized in the starting pool. Colors are as in Figure 1.
FIGURE 3.
FIGURE 3.
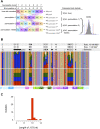
(A) Outline of Monte Carlo analysis of the kinetic effects of different nucleotides at each position in the ribozyme. At each position subjected to analysis, the pairings of nucleotide identity and rate constant were shuffled randomly 10,000 times, and the mean rate constants newly associated with each nucleotide were calculated. The t-statistic describing the difference in mean rate constants of ribozymes bearing, e.g., A and G residues was calculated for each permutation, revealing the underlying t-distribution and the critical values to which the true t-statistic was compared. Note that, whereas the canonical t-distribution (blue curve) has symmetric tails and thus symmetric critical values (blue vertical lines), the Monte Carlo simulation (gray bars) can reveal a t-distribution with markedly asymmetric tails and critical values (red lines). (B) Observed (top) and expected (bottom) nucleotide frequencies in the ligase selection. Red, G; blue, A; green, U; orange, C; white, gap. Less-saturated colors mark positions that were not deliberately varied in the pool. Above the colored bars are the results of Monte Carlo analyses of nucleotide identity effects on ribozyme kinetics at the indicated Mg2+ concentrations and of Fisher's exact test to detect significant deviation of observed from expected nucleotide frequencies. Open ovals indicate that a test was performed but revealed no significant effect; filled ovals indicate significant effects. The secondary-structure schematic below is colored as in Figure 1. (C) Histogram of the observed lengths of J1/3 sequences among successful ligase variants. J1/3 was varied from 2 to 10 nt in the starting pool; how some variants acquired longer J1/3 sequences is unknown.
FIGURE 4.
FIGURE 4.
(A) Representative NAIM gels for quantification of phosphorothioate and 2′-deoxy effects in the improved ligase. Secondary-structure cartoons, colored as in Figure 1, provide landmarks. 6% gels were used to resolve the 3′ half of the ligase (left), and 15% gels were used to resolve the 5′ half of the ligase (right). White arrowheads mark positions of particularly strong phosphorothioate interference; red arrowheads mark positions of particularly strong 2′-deoxy interference. (B) [α-Phosphorothioate]-2′-deoxyadenosine triphosphate (dATPαS), one of the eight nucleotide analogs used for NAIM. Use of the α-phosphorothioate-bearing ribonucleotides ATPαS, CTPαS, GTPαS, and UTPαS permits quantification of phosphorothioate interference effects and establishes a baseline for comparison with the α-phosphorothioate-bearing deoxyribonucleotides dATPαS, dCTPαS, dGTPαS, and dUTPαS to determine 2′-deoxy interference effects (Conrad et al. 1995; Strobel and Shetty 1997; Ryder and Strobel 1999). The stereoisomer shown bears a pro-Sp sulfur substitution; this isomer is the only isomer recognized by T7 RNA polymerase, but because polymerization proceeds with inversion of stereochemistry, all sulfur substitutions in the resulting RNA are in the pro-Rp position (Verma and Eckstein 1998).
FIGURE 5.
FIGURE 5.
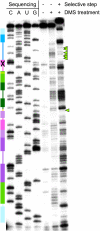
A representative primer-extension gel for quantification of DMS interference in the improved ligase, with sites of strong interference in single-stranded regions marked by green arrowheads. The secondary structure cartoon is colored as in Figure 1. Band identities were assigned using dideoxy sequencing ladders; due to extension pausing before modified nucleotides in experimental lanes, there is a one-base offset between experimental lanes and sequencing ladders. The gel compression that prevented analysis of nucleotides 34–41 is indicated by an X on the secondary-structure cartoon.
FIGURE 6.
FIGURE 6.
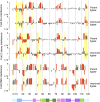
Log-scale maps of mean phosphorothioate (thio), 2′-deoxy, and DMS interference and enhancement effects in the parent and improved ligases. Positions of significant (95% confidence interval excludes 1.0) and strong (mean greater than or equal to twofold) effects are shown in red. Yellow bars highlight positions at which the mean fold effect differs both significantly (P < 0.05, t-test) and substantially (by a factor of ≥2) between the two ribozymes. Phosphorothioate interferences obscure possible 2′-deoxy effects at several positions in both ligases. DMS mapping by primer extension yields data only for A and C residues. Ribozyme positions are numbered below, with the secondary structure cartoon colored as in Figure 1.
FIGURE 7.
FIGURE 7.
Secondary-structure projections of the (A) parent and (B) improved class I ligase ribozymes, superimposed with the results of structural and sequence mapping. Dotted lines in A indicate the parent residues at which the C4′ atom was protected from Fe-EDTA-generated hydroxyl radicals (Bergman et al. 2004). Dotted lines in B indicate sites at which the C4′ atom was calculated to be solvent inaccessible in the crystal structure (Shechner et al. 2009). Phosphorothioate interference is shown in gray; 2′-deoxy interference is shown in orange; DMS interference is shown by downward-pointing red triangles, and DMS enhancement by upward triangles. In B, positions at which the Monte Carlo analysis revealed a significant association between nucleotide identity and activity are highlighted by blue circles if the effect appeared at 10 mM Mg2+ and by green and blue rings if the effect appeared at both 10 mM and 1 mM Mg2+.
FIGURE 8.
FIGURE 8.
Structural interactions suggested by the crystal structure (Shechner et al. 2009) and confirmed as functionally significant by NAIM and DMS interference experiments. (A) Contacts with structural metals near (left) A31–A32, (middle) G45–C47, and (right) G75–G77. Pro-Rp phosphate oxygens for which phosphorothioate NAIM interference was significant are shown as larger gray spheres; pro-Sp oxygens are not accessible to NAIM (Verma and Eckstein 1998). Meshes represent simulated-annealing |Fobs|-|Fcalc| OMIT maps in which the hydrated metal clusters were excluded from map calculations, contoured at (left) 4σ, and (middle, right) 2.5σ. Black dashed lines indicate hydrogen bonds. Solid lines bound to Mg2+ ions indicate proposed inner-sphere contacts. (B) Wall-eyed stereograph highlighting interactions between J1/3 and the P3–P6–P7 domain. Functional groups showing significant interference in biochemical experiments are shown as larger spheres, colored white for 2′-deoxy interference, gray for phosphorothioate interference, and black for DMS interference. (C) Individual base triples or quadruples involved in this interaction, rendered as in B.
FIGURE 9.
FIGURE 9.
Results of interference mapping projected onto the improved class I ligase crystal structure (Shechner et al. 2009). (A) Projections of (left) phosphorothioate, (middle) 2′-deoxyribonucleotide, and (right) dimethyl sulfate interference mapping results in the improved ligase onto the view of the ligase shown in Figure 1A. The ligation junction is highlighted in red. Residue colors are scaled from green (strong enhancement) to magenta (strong interference). Positions at which interference could not be quantified are colored white. For clarity, positions at which DMS interference arises from Watson–Crick pairing in known helices are not colored. (B) Projections of the extent of evolutionary change seen in the (left) phosphorothioate, (middle) 2′-deoxyribonucleotide, and (right) dimethyl sulfate interference maps of the parent and improved ligase ribozymes. The mean effect in the improved ligase was divided by the mean effect in the parent ribozyme and the results scaled from green (stronger enhancement or weaker interference—i.e., less reliance on the unperturbed residue—in the improved ligase) to magenta (weaker enhancement or stronger interference in the improved ligase). The cluster of changes in the boxed region at the 5′ end of J1/3 is discussed in the text.

Similar articles

Cited by

References

    1. Bartel DP, Szostak JW. Isolation of new ribozymes from a large pool of random sequences. Science. 1993;261:1411–1418. - PubMed
    1. Bergman NH, Johnston WK, Bartel DP. Kinetic framework for ligation by an efficient RNA ligase ribozyme. Biochemistry. 2000;39:3115–3123. - PubMed
    1. Bergman NH, Lau NC, Lehnert V, Westhof E, Bartel DP. The three-dimensional architecture of the class I ligase ribozyme. RNA. 2004;10:176–184. - PMC - PubMed
    1. Conrad F, Hanne A, Gaur RK, Krupp G. Enzymatic synthesis of 2′-modified nucleic acids: Identification of important phosphate and ribose moieties in RNase P substrates. Nucleic Acids Res. 1995;23:1845–1853. - PMC - PubMed
    1. Delano WL. PyMOL. DeLano Scientific. 2002. < http://pymol.sourceforge.net>.

Publication types

LinkOut - more resources