Review
. 2009 Dec;73(4):565-76.
doi: 10.1128/MMBR.00033-09.

Mapping the tree of life: progress and prospects

Affiliations
Review

Mapping the tree of life: progress and prospects

Norman R Pace. Microbiol Mol Biol Rev. 2009 Dec.

Abstract

The intent of this article is to provide a critical assessment of our current understanding of life's phylogenetic diversity. Phylogenetic comparison of gene sequences is a natural way to identify microorganisms and can also be used to infer the course of evolution. Three decades of molecular phylogenetic studies with various molecular markers have provided the outlines of a universal tree of life (ToL), the three-domain pattern of archaea, bacteria, and eucarya. The sequence-based perspective on microbial identification additionally opened the way to the identification of environmental microbes without the requirement for culture, particularly through analysis of rRNA gene sequences. Environmental rRNA sequences, which now far outnumber those from cultivars, expand our knowledge of the extent of microbial diversity and contribute increasingly heavily to the emerging ToL. Although the three-domain structure of the ToL is established, the deep phylogenetic structure of each of the domains remains murky and sometimes controversial. Obstacles to accurate inference of deep phylogenetic relationships are both systematic, in molecular phylogenetic calculations, and practical, due to a paucity of sequence representation for many groups of organisms.


Figures

FIG. 1.
FIG. 1.
Sequence uncertainty with depth in a phylogenetic tree. Dashed line, not corrected for unseen changes; solid line, corrected for unseen changes using the following estimation: inferred sequence change (Knuc) = −3/4 ln[1 − (4/3)D], where D is the number of changes counted (31).
FIG. 2.
FIG. 2.
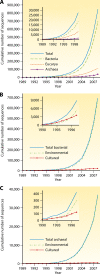
Chronological accumulation of SSU rRNA sequences. The data are derived from the SILVA 98 SSU Parc database (52) using the EMBL taxonomic designations for the sequences (66). The SILVA SSU Parc database contains rRNA sequences that are 300 or more nucleotides in length and validated as rRNA with RNAmmer (43). (A) Accumulation of total, archaeal, bacterial, and eucaryal SSU sequences. (B) Accumulation of rRNA sequences from cultured and environmental bacteria. (C) Accumulation of rRNA sequences from cultured and environmental archaea.
FIG. 3.
FIG. 3.
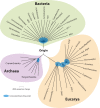
A molecular ToL based on rRNA sequence comparisons. The diagram compiles the results of many rRNA sequence comparisons. Only a few of the known lines of descent are shown.
FIG. 4.
FIG. 4.
Distribution of SSU rRNA sequences among the top 12 bacterial phyla. Shown is the SSU rRNA sequence distribution in the SILVA 98 SSU Parc database (52) among the bacterial phyla (Ribosomal Database Project taxonomy) (10) containing the most rRNA sequences.
FIG. 5.
FIG. 5.
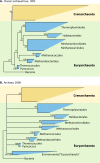
Archaeal rRNA trees with sequences available in 1993 and 2008. Archaeal SSU rRNA sequences available in 1993 (classic archaeal tree) (A) and in 2008 (B) were used in maximum likelihood bootstrap analysis with RAxML (64) as described previously (56, 57). The boxes represent radiations within the groups, with the long and short dimensions reflecting the line segment lengths within the groups. The sizes of the boxes reflect sequence representation for the groups. The numbers at the base of the boxes are bootstrap percentages. The box labeled Environmental “Euryarchaeota” is not a phylogenetically coherent group.
FIG. 6.
FIG. 6.
Distribution of SSU rRNA sequences among the top 12 eucaryal phyla. Shown is SSU rRNA sequence distribution in the SILVA 98 SSU Parc database (52) among the eucaryotic phyla (EMBL taxonomy [66]) containing the most rRNA sequences.

Similar articles

Cited by

References

    1. Amann, R. I., W. Ludwig, and K. H. Schleifer. 1995. Phylogenetic identification and in situ detection of individual microbial cells without cultivation. Microbiol. Rev. 59:143-169. - PMC - PubMed
    1. Angert, E. R., D. E. Northup, A.-L. Reysenbach, A. S. Peek, B. M. Goebel, and N. R. Pace. 1998. Molecular phylogenetic analysis of a bacterial community in Sulfur River, Parker Cave, Kentucky. Am. Mineralogist 83:1583-1592.
    1. Baldauf, S. L., A. J. Roger, I. Wenk-Siefert, and W. F. Doolittle. 2000. A kingdom-level phylogeny of eukaryotes based on combined protein data. Science 290:972-977. - PubMed
    1. Barns, S. M., C. F. Delwiche, J. D. Palmer, and N. R. Pace. 1996. Perspectives on archaeal diversity, thermophily and monophyly from environmental rRNA sequences. Proc. Natl. Acad. Sci. USA 93:9188-9193. - PMC - PubMed
    1. Bergsten, J. 2005. A review of long-branch attraction. Cladistics 21:163-193. - PubMed

Publication types

LinkOut - more resources