

doi: 10.1038/nchembio.277.
Epub 2009 Nov 29.
In vivo selection of tumor-targeting RNA motifs
Affiliations
- PMID: 19946274
- PMCID: PMC2795795
- DOI: 10.1038/nchembio.277
Item in Clipboard
In vivo selection of tumor-targeting RNA motifs
Nat Chem Biol.
2010 Jan.
Abstract
In an effort to target the in vivo context of tumor-specific moieties, we screened a large library of nuclease-resistant RNA oligonucleotides in tumor-bearing mice to identify candidate molecules with the ability to localize to hepatic colon cancer metastases. One of the selected molecules is an RNA aptamer that binds to p68, an RNA helicase that has been shown to be upregulated in colorectal cancer.
Figures
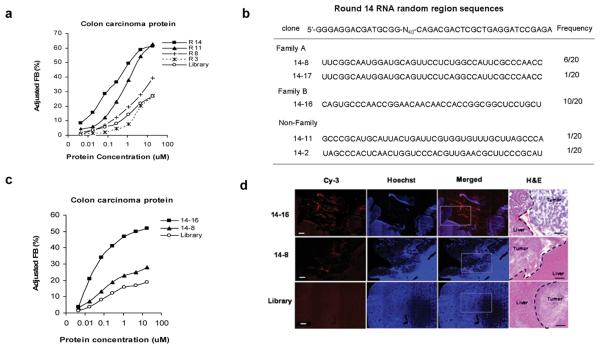
CT26 intrahepatic tumor-evolved in vivo RNA selection pools. (a) RNA pools from rounds 14, 11, 8, and 3 and from the starting round were assayed in vitro for binding to tumor extracted protein. Protein concentration was determined by molecular weight of 50 kDa. (b) RNA pool of round 14 was sequenced and their random region sequences were shown in the table. (c) The representative RNA molecules 14-16 and 14-8 were assayed for binding in vitro to tumor extracted protein. (d) Tumor-specific targeting of selected RNA motifs. Fluorescence microscopy reveals the distribution of RNA molecules (red) in tumors, a region that is characterized by poor perfusion of Hoechst 33342 (blue) after intravenous injection (50× magnification). The boxed region is further analyzed by hematoxylin and eosin (H&E) stain (100 × magnification). The scale bar is 100μm and applies to all panels.

(a) RNAs binding as analyzed by gel-shift assay. Proteins were extracted from tumor, normal liver, normal colon, and colon carcinoma CT26 cells, respectively, and incubated with (γ-32P) ATP end-labeled 14-16 (left pane) or 14-8 RNA (right panel). The final products were resolved on 6% poly-acrylamide gel and visualized by autoradiography. In competitive and non-competitive binding assays, unlabeled RNAs were added at a 25-fold molar excess, respectively. The gel is representative of three experiments. (b) Coomassie blue-stained SDS-PAGE gel analyzing the aptamer 14-16-mediated target purification. Lane 1, molecular marker; lane 2, purification with control aptamer library as a control; and lane 3, purification with aptamer 14-16. (c) In vitro binding assays confirming that in vivo selected RNA 14-16 is an aptamer that binds specifically to recombinant protein p68. (d) Aptamer 14-16-mediated inhibition of p68 ATPase activity. ATP hydrolysis was measured in the absence or presence of 20 ng/μl (0.6 μM) RNA 14-16. *p < 0.05 versus library group without stimulation; #p < 0.05 versus library group with stimulation. The assay is representative of three experiments.
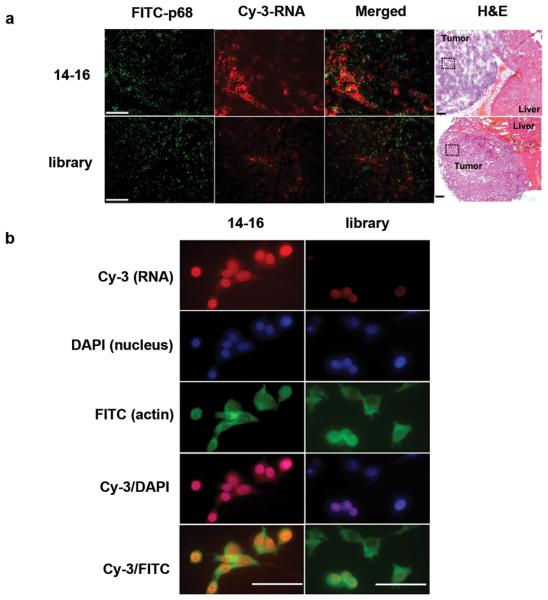
Overlapping localization of aptamer 14-16 and p68 expression. (a) Representative fluorescence microscopy image showing that the majority of intravenously injected aptamer 14-16 (red) was co-localized with p68 expressing tumor (green) and not normal liver tissue (upper panel), but that the control RNA did not similarly co-localize (lower panel) (100 × magnification). The overlapping localization is found in tumor, and the boxed region has been analyzed by H&E stain (40× magnification). Bar, 100 μm. (b) Aptamers traverse into CT 26 cells. Fixed cells were stained using Cy3- labeled aptamer 14-16 (red), DAPI (blue), and FITC-labeled anti-actin antibody (green). Merged, co-localized areas appear pink (red/blue) for nuclear-localized aptamers and light green (red/green) for cytoplas- localized aptamers.

References
Publication types
MeSH terms
Substances
Grants and funding
LinkOut - more resources
Full Text Sources
Other Literature Sources
Medical
