. 2006 Oct 1;69(10):2709-2759.
doi: 10.1088/0034-4885/69/10/R01.

RECENT IMPROVEMENTS IN SMALL ANGLE X-RAY DIFFRACTION FOR THE STUDY OF MUSCLE PHYSIOLOGY

Affiliations

RECENT IMPROVEMENTS IN SMALL ANGLE X-RAY DIFFRACTION FOR THE STUDY OF MUSCLE PHYSIOLOGY

Massimo Reconditi. Rep Prog Phys. .

Abstract

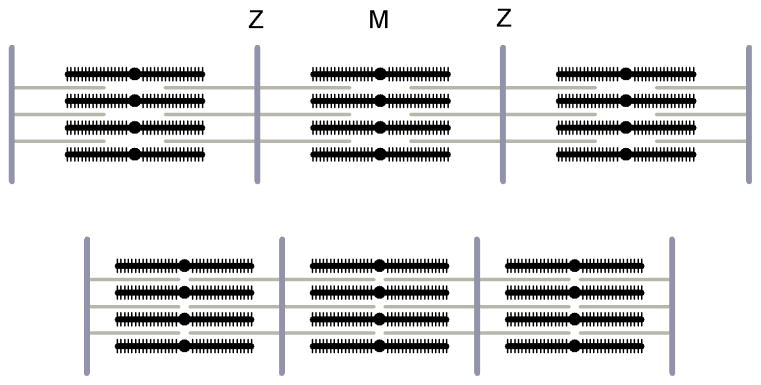
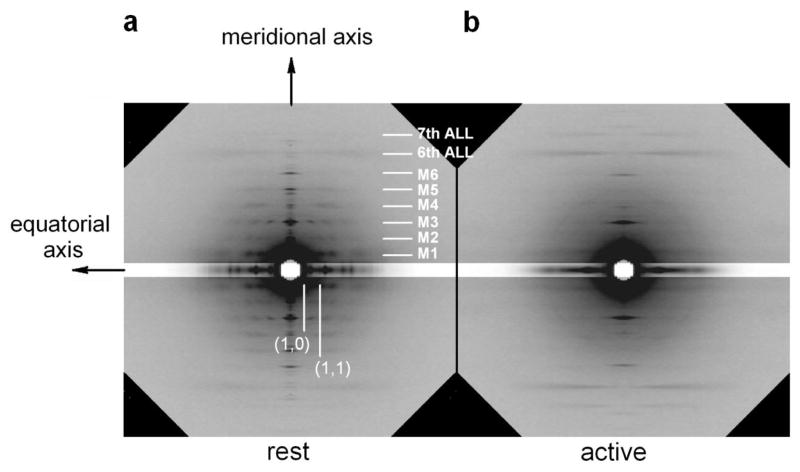
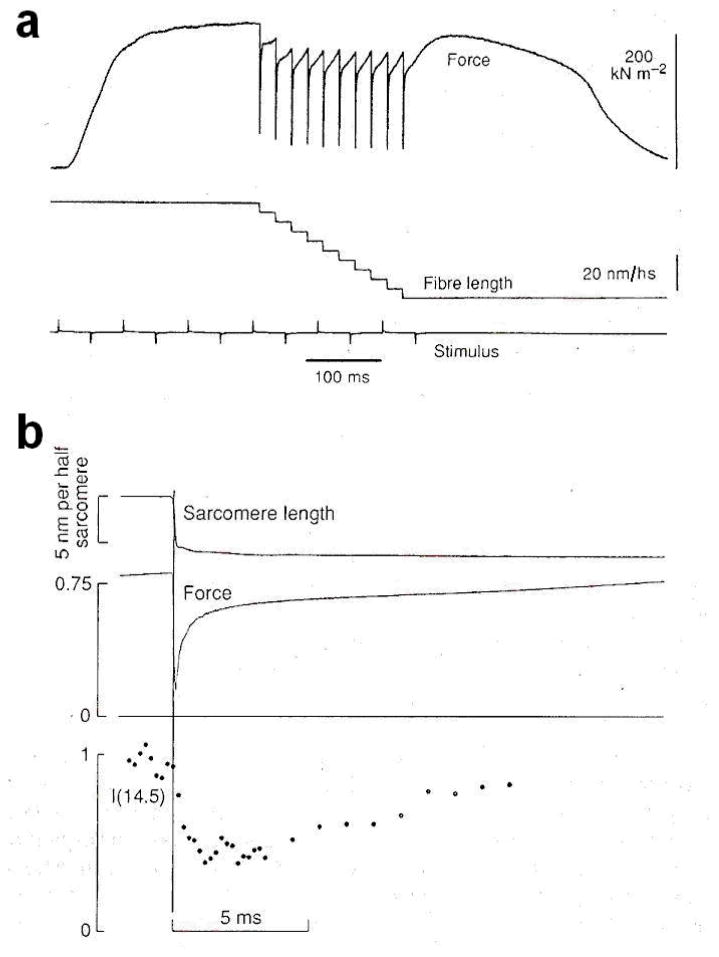
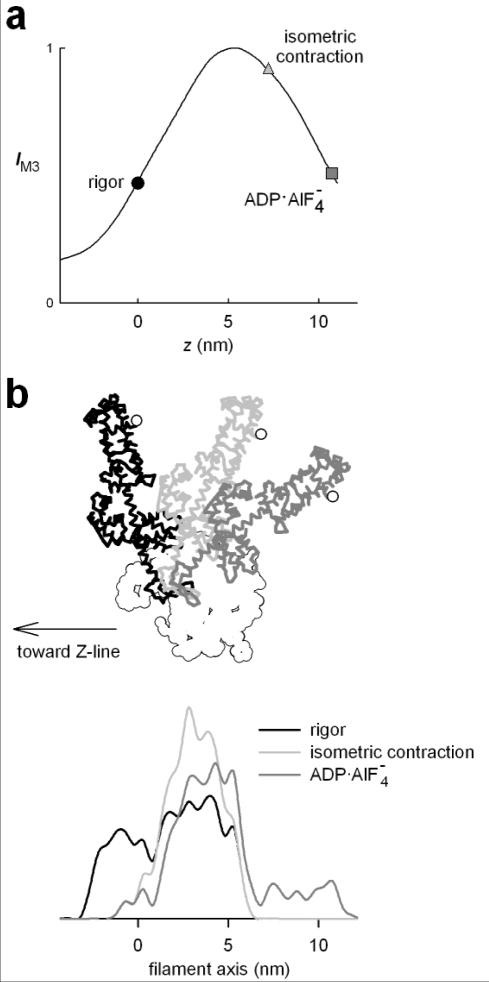
The molecular mechanism of muscle contraction is one of the most important unresolved problems in Biology and Biophysics. Notwithstanding the great advances of recent years, it is not yet known in detail how the molecular motor in muscle, the class II myosin, converts the free energy of ATP hydrolysis into work by interacting with its track, the actin filament, neither it is understood how the high efficiency in energy conversion depends on the cooperative action of myosin motors working in parallel along the actin filament. Researches in muscle contraction imply the combination of mechanical, biochemical and structural methods in studies that span from tissue to single molecule. Therefore, more than for any other research field, progresses in the comprehension of muscle contraction at molecular level are related to, and in turn contribute to, the advancement of methods in Biophysics.This review will focus on the progresses achieved by time resolved small angle X-ray scattering (SAXS) from muscle, an approach made possible by the highly ordered arrangement of both the contractile proteins myosin and actin in the ca 2 mum long structural unit the sarcomere that repeats along the whole length of the muscle cell. Among the time resolved structural techniques, SAXS has proved to be the most powerful method of investigation, as it allows the molecular motor to be studied in situ, in intact single muscle cells, where it is possible to combine the structural study with fast mechanical methods that synchronize the action of the molecular motors. The latest development of this technique allows Angstrom-scale measurements of the axial movement of the motors that pull the actin filament toward the centre of the sarcomere, by exploiting the X-ray interference between the two arrays of myosin motors in the two halves of the sarcomere.


Figures

Figure 1
Figure 1
a. Levels of structural organization in a typical vertebrate skeletal muscle. The muscle consists in bundles of long, cylindrical fibres, each fibre is a muscle cell. Each fibre contains a bundle of cylindrical myofibrils, mainly composed by the contractile proteins. The contractile proteins are organized in filaments arranged into repeating units, the sarcomeres. b. Longitudinal section of frog sartorious muscle, as seen by electron microscopy, together with the diagram showing the overlapping actin (gray) and myosin (black) filaments (adapted from H.E. Huxley, 1972). c. Scheme of the cross section of a sarcomere in the overlap region, with myosin (black) and actin (gray) filaments arranged on regular hexagonal arrays. The elementary cell contains one myosin filament and two actin filaments. The crystallographic planes 1,0 and 1,1 are also indicated. The interplanary distances are d(1,0)=3·d(1,1).
Figure 2
Figure 2
a. Schematic diagram of the myosin molecule, with flexible link between LMM and HMM and between S2 and S1 subfragments. The LMM is about 90 nm long. The S2 portion of HMM is about 60 nm and links the two S1 “heads”. b. Arrangement of the myosin molecules to form the thick filament. The bare zone is indicated, where the LMM “tails” arrange antiparallel and leave the region free of myosin heads.
Figure 3
Figure 3
a. Diagram showing the arrangement of myosin heads on the myosin filament in vertebrate striated muscle. The myosin heads (black) emerge axially from the thick filament (gray) as crown of three pairs with 14.5 nm periodicity. In each crown the pairs of heads are separated azimuthally by 120° and adjacent crowns are rotated by 40°, forming a three stranded helix with period ca 43 nm (dotted lines). b. Helical symmetry of the actin filament. Successive monomers can be arranged on two primitive helices (black lines). The right handed helix has a pitch of 5.1 nm and the left handed helix has a pitch of 5.9 nm. The overall appearance is of two interwining helices with a pitch of ca 37.5 nm. The gray dashed line marks one of the two long helix.
Figure 4
Figure 4
Schematic drawn of the thin filament. Tropomyosin molecules (black strip) run in the groove between the two actin helices (white spheres), and bind to seven actin monomers on each helix. At one end of tropomyosin binds a troponin molecule (gray).
Figure 5
Figure 5
Diagram to show the change in overlap of the thick (black) and thin (gray) filament with changing sarcomere length (between Z lines), according to the sliding filaments theory. The length of the filaments remain constant as they slide past each other.
Figure 6
Figure 6
Force transient response in muscle fibre upon length step perturbation. Upper trace: length change at the level of the half-sarcomere, the length step is imposed on the otherwise isometrically contracting fibre. Middle trace: force response, with indicated the various phases (1–4) of the force transient, as described in par. 2.4. Lower trace: baseline for force. (Frog muscle; adapted from A.F. Huxley 1974).
Figure 7
Figure 7
The tilting head model originally proposed by Huxley 1969. The myosin head S1 is linked to the filament backbone through the S2 rod-like portion of the molecule. The S1 attaches to the actin filament (a, left S1) and undergoes a rotational movement (b, left S1) that pulls actin filament toward the centre of the myosin filament. Meantime, other molecules which have already rotated (a, right S1) detach to start the cycle again (b, right S1). (From H.E. Huxley 1969).
Figure 8
Figure 8
Ribbon representation of the subfragment S1 of the myosin molecule. Data from the crystallized S1 molecule in absence of ATP and the products of ATP hydrolysis (nucleotide-free). The catalytic domain (CD) and the light chain domain (LCD) are indicated. (From Rayment et al 1993.)
Figure 9
Figure 9
Atomic model for the working stroke. Gray spheres represents monomers of the actin filament; myosin head is shown in ribbon representation in both the nucleotide-free, or rigor, conformation (left) and in the adenosine triphosphate (ADP)AlF4 conformation (right). In the two conformations the catalytic domains (CD, residues 1–707) are made to coincide. The orientation of the light chain domain in the ADP AlF4 structure was determined by assuming that the converter-light chain domain (LCD), residues 711–843) moves as a rigid body about residue 707. The white circles between CD and LCD identify the position of the converter domain (residues 711–781) in the two conformations. (Adapted from Irving et al 2000).
Figure 10
Figure 10
Diffraction pattern from frog fibre at rest (a.) and during an isometric contraction (b.) In a are indicated the meridional and the equatorial axis, parallel and perpendicular to the fibre axis respectively. The white marks indicate the position of the meridional myosin-based reflections (M series), and of the actin-based layer lines (6th and 7th ALL). The equatorial reflection (1,0) and (1,1) are also indicated. The equatorial bands shown in the patterns have the intensity reduced to 1/3, to avoid saturation in the figure. Patterns collected at the ID2A beamline (ESRF synchrotron; Boesecke et al 1995) on the FReLoN CCD detector. Fibre dissected from the tibialis anterior muscle of Rana temporaria (4°C, 2.2 μm s.l.). The exposure time is 120 ms for each pattern.
Figure 11
Figure 11
Changes in force and intensity of the 14.5 nm X-ray reflection resulting from a staircase length change in an active single muscle fibre. a. Records of force and length changes with slow time base. The 10 shortening steps, each complete in 120 μs and resulting in filament sliding of about 6 nm/hs, are repeated at 20 ms interval. The lower line marks the time the electrical stimuli are delivered. b. Fast time base records of sarcomere length, force response and intensity of the M3 reflection, I(14.5), showing the average response to 6 nm/hs steps in a series of 10 steps at 20 ms interval, as in a. The sarcomere length and force traces are averaged from five fibres. Intensity data are recorded at 0.2 ms time frame during the length step and the rapid force recovery, and at 1 ms time frame during the slower force recovery to the isometric value. The vertical line marks the midpoint of the length step. Sarcomere length is monitored by a Striation Follower (Huxley et al 1981). Force is normalized to the isometric value and intensity is normalized to its value before the step. From Irving et al 1992.
Figure 12
Figure 12
a. Relation between calculated intensity of the M3 reflection (IM3) and Δz, the axial displacement of the tip of the lever arm from the position in the rigor conformation (black circle). Dark gray square and light gray triangle indicate the conformation of S1 with the ADP AlF4 compound and during isometric contraction respectively. (Adapted from Irving et al 2000). b. Model used to calculate the relation IM3z shown in a. The catalytic domain (white) is at fixed position and the light chain domain is oriented according to the three different conformations: rigor (black); isometric contraction (light gray); ADP AlF4 (dark gray). The white circle identifies the tip of the lever arm (residue 843). The lower traces show the axial mass density in the three conformations.
Figure 13
Figure 13
Changes in force and intensity of the M3 reflection, IM3, produced by a ca 6 nm/hs shortening step followed after 1 ms by a stretch during active contraction. a. Superimposed slow time base force records in the presence and absence of the 40 length changes cycles imposed at 50 ms intervals. Changes in length (b.) and force (c.) in the same fibre as panel a, sampled at 10 μs intervals, and IM3 (d., filled circles, 100 μs time windows) averaged from 402 tetani in 14 fibres. IM3 is normalised for the average value before the shortening step. (Adapted from Irving et al 2000.)
Figure 14
Figure 14
Distributed strain in the half-sarcomere. a. Schematic representation of the structure of the half-sarcomere at sarcomere length 2.1 μm. lM, the length of the myosin filament, is 0.8 μm; ζ, the length of the overlap region, is 0.7 μm; lA, the length of the actin filament from the Z line to the beginning of the bare zone, is 0.95 μm. b. Distribution of the force along the myosin and actin filament. (Adapted from Linari et al 1998.)
Figure 15
Figure 15
High spatial resolution 2D pattern from single fibre of frog at rest. The meridional reflections are sampled by the interference fringes. The 2D pattern has been mirrored and the intensity profile is obtained from integration between 1/100 nm−1 on both side of the meridional axis. The myosin based meridional reflections are indicated. Exposure time 700 ms; fibre dissected from the tibialis anterior muscle of frog. The high spatial resolution is obtained thanks to the finely focused beam at BioCAT beamline (APS synchrotron; Irving et al 2000) and 65μm-PSF CCD detector (Phillips et al 2002).
Figure 16
Figure 16
Schematic representation of the pattern produced by two arrays of point diffractors with periodicity d, separated by a centre-to-centre distance D. a. The double array can be seen as the convolution of the single array with two points separated by D. b. The intensity distribution from the two arrays (right, thicker line) is given by the product of the intensity distributions of a single array (left, black line) and the two points (middle, gray line). The n order of the interference fringes in the middle panel is the integer closest to D/d.
Figure 17
Figure 17
Model for the heads arrangement on the myosin filament at rest. Each vertical bar represents the axial position of a crown of heads. a. On each half filament, starting from the bar zone, the first 39 crowns are grouped in triplets (black bars). The axiual distance between the centres of next triplets is 42.9 nm and the distance of next crown in each triplet is 13.1 nm. On the free end of the half filament, the crowns repeat with a regular spacing of 14.3 nm (gray bars). b. On the whole filament, the centre-to-centre distance between the two arrays of triplets is 704 nm. Bare zone is ca 160 nm. (Adapted from Malinchik and Lednev 1992).
Figure 18
Figure 18
Axial X-ray diffraction patterns from a single muscle fibre at rest (a) and at the plateau of an isometric tetanus (b). Sarcomere length 2.06 μm; exposure time 6 s in both conditions. The meridional myosin-based reflection are indicated on the left. The scale on the right refers to the reciprocal space.
Figure 19
Figure 19
Sarcomere length dependence of the axial intensity distribution of the M3 reflection at the plateau of the isometric tetanus. As the sarcomere length increases, the intensity of the reflection decreases while the peak ratio does not change. (Adapted from Linari et al 2000).
Figure 20
Figure 20
a. Schematic model for the myosin head during isometric contraction. The thick filamenti s composed by two arrays of 50 heads, with 14.57 nm repeat. Each head is represented as two rectangular parts, extending for 7 nm (a) and 2.5 nm (b) along the filament axis. The mass of a is 3.5 the mass of b. The centre-to-centre distance of the two arrays formed by the a and b masses are 868.6 nm and 861.1 nm respectively. b. Predicted intensity distribution of the M3 reflection during isometric contraction. Upper panel: dashed lines: Fourier Transform of the a mass (gray) and of the b mass (black); thin continuous lines: interference fringes generated from the two arrays of a masses (gray) and b masses (black); thick black line, intensity distribution predicted by the complete model. In this model, the region of the head attached to actin (a) influences more the M3 reflection, while the region closet to the myosin filament (b) influences more the M6 reflection. c. Comparison of the intensity distribution predicted by the model (thin line) with the intensity distribution observed during the isometric contraction (thick line), for the M3 and the M6 reflections.
Figure 21
Figure 21
Aaxial intensity distribution of the myosin-based meridional reflections at the plateau of the isometric tetanus after background subtraction. For each reflection the intensity is scaled to normalise the height of the main peak. The intensity of the M12 reflection does not rise above the noise level and is not shown. (Adapted from Juanhuix et al 2001).
Figure 22
Figure 22
M3 intensity profiles calculated from the two-head model. a. and d. Isometric contraction. b. and e. Low-force rigor. c. and f. High force rigor. in a–c, the two heads of one myosin molecule are shown in light and dark gray; actin monomers are shown as white spheres. In d–f, experimental intensity profiles (black circles) and calculated profiles from the two-head model convolved with the point spread function of the X-ray beam and detector (continuous line; from Reconditi et al 2003).
Figure 23
Figure 23
Change in the interference fine structure of the M3 reflection following a shortening step. a. Length change and force response. The thick gray segments in the force trace mark the X-ray exposure windows: T0, before the step; T1, at the end of the elastic response; T2, at the end of quick recovery. b. Axial intensity distribution of the M3 reflection, normalised to the height of the lower angle peak, recorded in the three time windows shown in a. (Adapted from Piazzesi et al 2002).
Figure 24
Figure 24
Changes in IHA/ILA following shortening steps of different sizes. White circles and black triangles are the values at T1 and at T2 respectively. The black square represents the value just before the length step. The lines are calculated from the model described in the text: gray, T1; black, T2. Continuous lines indicate that only one head of each myosin responds to the length step; gray dashed line (T1) is the prediction of a model where all the heads in the fibre respond to the step; black dashed line (T2) is the prediction of the rapid detachment-attachment model. (From Piazzesi et al 2002).
Figure 25
Figure 25
Axial motion (ΔC) of myosin head centre of mass with respect to the myosin filament attachment. White circles and black triangles are the values at T1 and at T2 respectively. The values of ΔC are obtained from the values of IHA/ILA in figure 24. Negative values of ΔC denote motion toward the centre of the myosin filament. Gray and black line represents the linear regression on the T1 and T2 data respectively, except the point at −9nm/hs. (From Piazzesi et al 2002).
Figure 26
Figure 26
Changes in the interference fine structure of the M3 reflection following a load step, and explanation in terms of the axial motions of the myosin heads. a. Force step and length change. Numbers 1–4 indicate the phases of the velocity transient as described in the text. The thick gray segments in the length trace mark the X-ray exposure windows: L0, before the load step; L2s, start of phase 2; L2e, end of phase 2; L3, end of phase 3. b. Axial intensity distribution of the M3 reflection recorded in the four time windows shown in a. c–f Motions of the myosin heads at the four phases of the velocity transient shown in a. (Adapted from Reconditi et al 2004).
Figure 27
Figure 27
Load dependence of the axial motions of myosin heads. a. Velocity transients following step reductions in force to 0.75, 0.5, and 0.25 T0. b. IHA/ILA plotted against time for the three different loads: 0.75 T0 (black); 0.5 T0 (white); 0.25 T0 (gray). The lines are drawn for visual help to follow the time courses. c. Relation between IHA/ILA and the extent of filament sliding, from the same experiments as b. (From Reconditi et al 2004).
Figure A1
Figure A1
Convolution of the Point Spread Function (PSF) of the beam and detector system with the predicted intensity distribution. Thin black line, intensity profile predicted by the model for the two arrays of myosin heads; thin gray line: PSF of the system (FWHM δs); thick line: convolution between the two profiles. a. Camera length L=12δs;; b. L=17δs; c. L=30δs. Where δs is measured in millimeters and L in metres.
Figure A2
Figure A2
Relation between the peak ratio of the M3 reflection and D, the centre-to-centre distance between the two arrays of heads. a. Relation between IHA/ILA and D in the range 860–867 nm. b. Relation between IHA/ILA (solid lines) or ILA/IHA (dashed lines) and D in the range 840–880 nm. The circle indicates the value of IHA/ILA in isometric contraction and the triangle indicates the value of ILA/IHA in rigor.
Figure A3
Figure A3
Solid line: relation between the apparent intensity (a.) and spacing (b.) of the sampled M3 reflection and D, the centre-to-centre distance between the two arrays of heads. The values are relative to the unsampled reflection. Dashed line: peak ratio as in figure A2.
Figure A4
Figure A4
Axial mass density of the myosin head S1 for various angles of tilt of the light chain domain (LCD) relative to the filament axis, with the catalytic domain (CD) in the conformation of Rayment et al 1993b. The origin of the axis is on the residues 843, the tip of the lever arm. Lighter gray means higher mass density. Solid line: centre of mass of the molecule; dotted line: centre of mass of the CD; dashed line: apparent changes in the interference distance due to the change of φ(R) at the level of the M3 reflection, for R=1/14.5 nm. The dashed line is calculated as φ(R)/2πR for R=1/14.57 nm−1, as described in the text and in par. 5.5. a. Mass density of a single myosin head. The white dotted lines indicate the conformation of S1 in rigor as in Rayment et al 1993b and in isometric contraction as in Irving et al 2000. b. Mass density of two heads, sharing the head-rod junction at residue 843. One head has the LCD at a fixed angle of 70° to the filament axis. The white dotted line indicates the conformation in isometric contraction as in Piazzesi et al 2002b.

References

    1. Boesecke P, Diat O, Rasmussen B. High brilliance beamline at the European Synchrotron Radiation Facility. Rev Sci Instrum. 1995;66:1636–1638.
    1. Bordas J, Diakun GP, Diaz FG, Harries JE, Lewis RA, Lowy J, Mant GR, Martin-Fernandez ML, Towns-Andrews E. Two-dimensional time-resolved X-ray diffraction studies of live isometrically contracting frog sartorius muscle. J Muscle Res Cell Motil. 1993;14:311–324. - PubMed
    1. Bordas J, Lowy J, Svensson A, Harries JE, Diakun GP, Gandy J, Miles C, Mant GR, Towns-Andrews E. X-ray evidence that in contracting live frog muscles there exist two distinct populations of myosin heads. Biophys J. 1995;68:99S–105S. - PMC - PubMed
    1. Cooke R, Crowder MS, Thomas DD. Orientation of spin labels attached to cross-bridges in contracting muscle fibres. Nature. 1982;300:776–778. - PubMed
    1. Cooke R, Franks K. All myosin heads form bonds with actin in rigor rabbit skeletal muscle. Biochemistry. 1980;19:2265–2269. - PubMed

LinkOut - more resources