

Pericellular Matrix Mechanics in the Anulus Fibrosus Predicted by a Three-Dimensional Finite Element Model and In Situ Morphology
- PMID: 19946619
- PMCID: PMC2782835
- DOI: 10.1007/s12195-009-0081-7
Pericellular Matrix Mechanics in the Anulus Fibrosus Predicted by a Three-Dimensional Finite Element Model and In Situ Morphology
Abstract
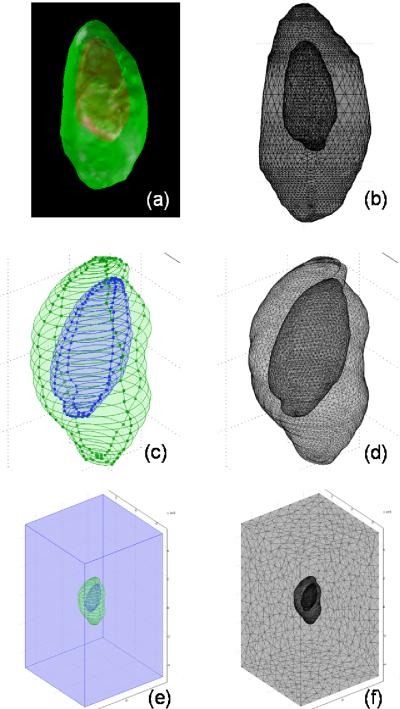
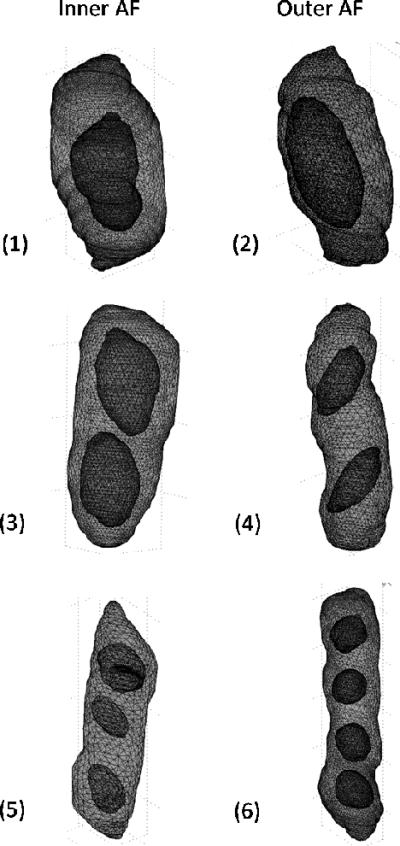
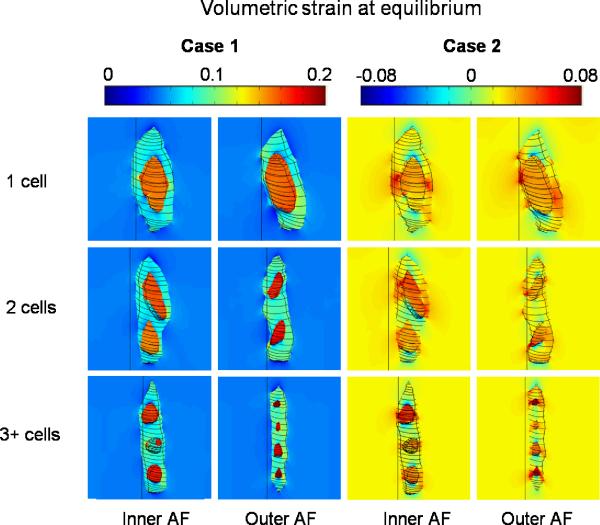
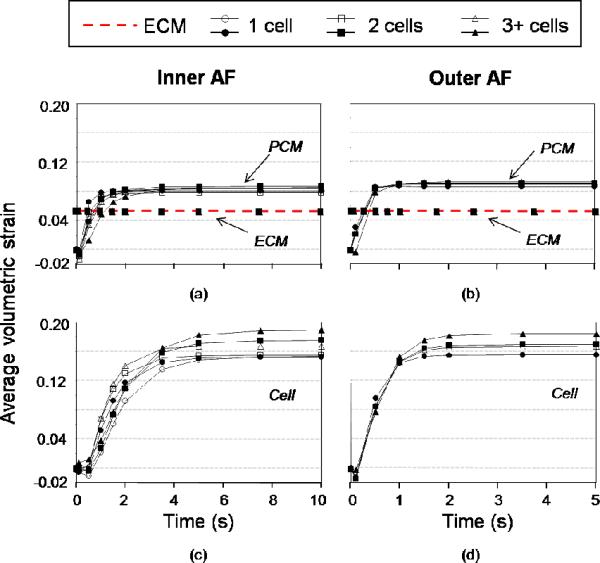
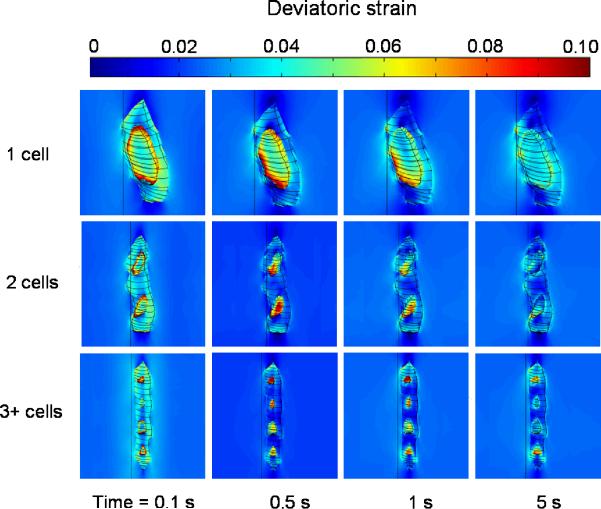
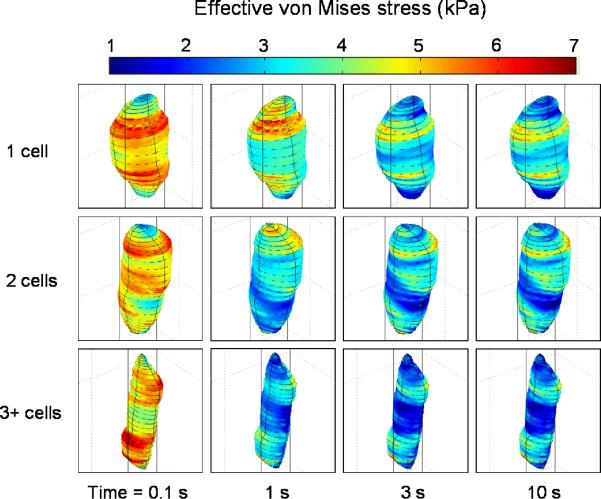
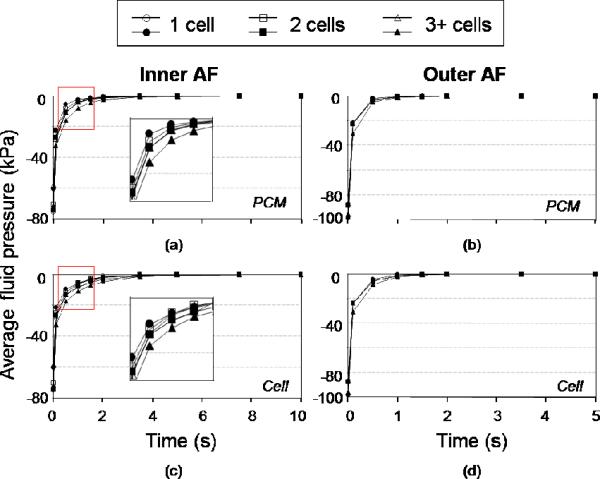
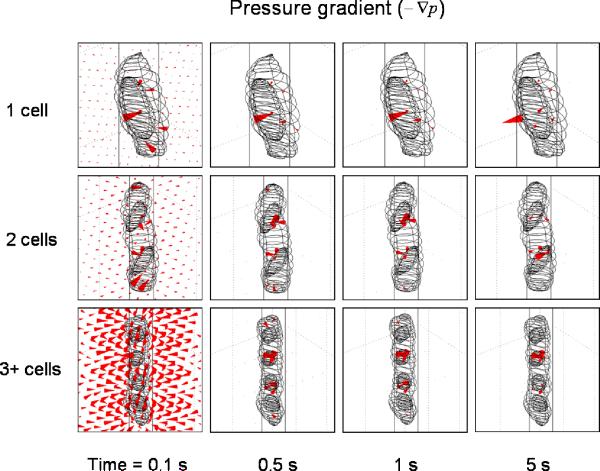
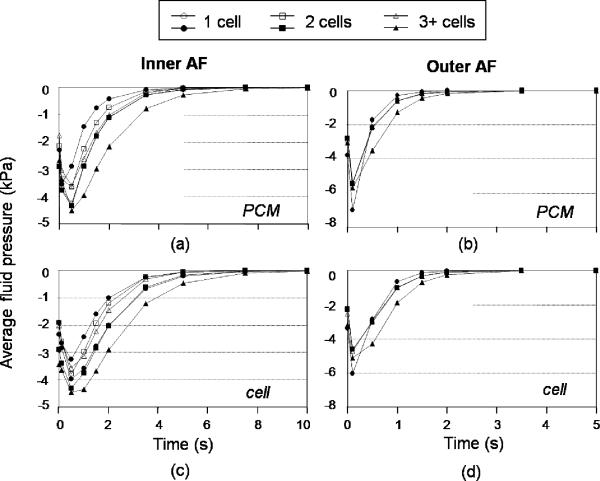
Anulus fibrosus (AF) cells have been demonstrated to exhibit dramatic differences in morphology and biologic responses to different types of mechanical stimuli. AF cells may reside as single cell, paired or multiple cells in a contiguous pericellular matrix (PCM), whose structure and properties are expected to have a significant influence on the mechanical stimuli that these cells may experience during physiologic loading of the spine, as well as in tissue degeneration and regeneration. In this study, a computational model was developed to predict the micromechanical stimuli, such as stress and strain, fluid pressure and flow, of cells and their surrounding PCM in the AF tissue using three-dimensional (3D) finite element models based on in situ morphology. 3D solid geometries of cell-PCM regions were registered from serial confocal images obtained from mature rat AF tissues by custom codes. Distinct cell-matrix units were modeled with a custom 3D biphasic finite element code (COMSOL Multiphysics), and simulated to experience uni-axial tensile strain along the local collagen fiber direction. AF cells were predicted to experience higher volumetric strain with a strain amplification ratio (relative to that in the extracellular matrix) of ~ 3.1 - 3.8 at equilibrium, as compared to the PCM domains (1.3 - 1.9). The strain concentrations were generally found at the cell/PCM interface and stress concentration at the PCM/ECM interface. Increased numbers of cells within a contiguous PCM was associated with an apparent increase of strain levels and decreased rate of fluid pressurization in the cell, with magnitudes dependent on the cell size, shape and relative position inside the PCM. These studies provide spatio-temporal information on micromechanics of AF cells in understanding the mechanotransduction in the intervertebral disc.
Figures
Similar articles
-
Three-dimensional finite element modeling of pericellular matrix and cell mechanics in the nucleus pulposus of the intervertebral disk based on in situ morphology.Biomech Model Mechanobiol. 2011 Feb;10(1):1-10. doi: 10.1007/s10237-010-0214-x. Epub 2010 Apr 8. Biomech Model Mechanobiol. 2011. PMID: 20376522 Free PMC article.
-
The micromechanical environment of intervertebral disc cells determined by a finite deformation, anisotropic, and biphasic finite element model.J Biomech Eng. 2003 Feb;125(1):1-11. doi: 10.1115/1.1532790. J Biomech Eng. 2003. PMID: 12661192
-
The dynamic mechanical environment of the chondrocyte: a biphasic finite element model of cell-matrix interactions under cyclic compressive loading.J Biomech Eng. 2008 Dec;130(6):061009. doi: 10.1115/1.2978991. J Biomech Eng. 2008. PMID: 19045538 Free PMC article.
-
Mechanobiology of the intervertebral disc and relevance to disc degeneration.J Bone Joint Surg Am. 2006 Apr;88 Suppl 2:52-7. doi: 10.2106/JBJS.F.00001. J Bone Joint Surg Am. 2006. PMID: 16595444 Review.
-
The structure and function of the pericellular matrix of articular cartilage.Matrix Biol. 2014 Oct;39:25-32. doi: 10.1016/j.matbio.2014.08.009. Epub 2014 Aug 27. Matrix Biol. 2014. PMID: 25172825 Free PMC article. Review.
Cited by
-
Cartilaginous endplates: A comprehensive review on a neglected structure in intervertebral disc research.JOR Spine. 2023 Oct 21;6(4):e1294. doi: 10.1002/jsp2.1294. eCollection 2023 Dec. JOR Spine. 2023. PMID: 38156054 Free PMC article. Review.
-
Chondrocyte deformations as a function of tibiofemoral joint loading predicted by a generalized high-throughput pipeline of multi-scale simulations.PLoS One. 2012;7(5):e37538. doi: 10.1371/journal.pone.0037538. Epub 2012 May 23. PLoS One. 2012. PMID: 22649535 Free PMC article.
-
Computational Modeling of Developing Cartilage Using Experimentally Derived Geometries and Compressive Moduli.J Biomech Eng. 2019 Aug 1;141(8):0810021-8. doi: 10.1115/1.4043208. J Biomech Eng. 2019. PMID: 30874718 Free PMC article.
-
Molecular mechanisms of biological aging in intervertebral discs.J Orthop Res. 2016 Aug;34(8):1289-306. doi: 10.1002/jor.23195. Epub 2016 Aug 12. J Orthop Res. 2016. PMID: 26890203 Free PMC article. Review.
-
Perlecan in Pericellular Mechanosensory Cell-Matrix Communication, Extracellular Matrix Stabilisation and Mechanoregulation of Load-Bearing Connective Tissues.Int J Mol Sci. 2021 Mar 8;22(5):2716. doi: 10.3390/ijms22052716. Int J Mol Sci. 2021. PMID: 33800241 Free PMC article. Review.
References
-
- Acaroglu ER, Iatridis JC, Setton LA, et al. Degeneration and aging affect the tensile behavior of human lumbar anulus fibrosus. Spine. 1995;20(24):2690–2701. - PubMed
-
- Alexopoulos LG, Haider MA, Vail TP, et al. Alterations in the mechanical properties of the human chondrocyte pericellular matrix with osteoarthritis. Journal of Biomechanical Engineering. 2003;125(3):323–333. - PubMed
-
- Alexopoulos LG, Setton LA, Guilak F. The biomechanical role of the chondrocyte pericellular matrix in articular cartilage. Acta Biomater. 2005;1(3):317–325. - PubMed
-
- Alexopoulos LG, Williams GM, Upton ML, et al. Osteoarthritic changes in the biphasic mechanical properties of the chondrocyte pericellular matrix in articular cartilage. Journal of Biomechanics. 2005;38(3):509–517. - PubMed
-
- Almeida ES, Spilker RL. Finite element formulations for hyperelastic transversely isotropic biphasic soft tissues. Computer Methods in Applied Mechanics and Engineering. 1998;151(3–4):513–538.
Grants and funding
LinkOut - more resources
Full Text Sources
