

Correlation exploration of metabolic and genomic diversity in rice
- PMID: 19948071
- PMCID: PMC3087559
- DOI: 10.1186/1471-2164-10-568
Correlation exploration of metabolic and genomic diversity in rice
Abstract
Background: It is essential to elucidate the relationship between metabolic and genomic diversity to understand the genetic regulatory networks associated with the changing metabolo-phenotype among natural variation and/or populations. Recent innovations in metabolomics technologies allow us to grasp the comprehensive features of the metabolome. Metabolite quantitative trait analysis is a key approach for the identification of genetic loci involved in metabolite variation using segregated populations. Although several attempts have been made to find correlative relationships between genetic and metabolic diversity among natural populations in various organisms, it is still unclear whether it is possible to discover such correlations between each metabolite and the polymorphisms found at each chromosomal location. To assess the correlative relationship between the metabolic and genomic diversity found in rice accessions, we compared the distance matrices for these two "omics" patterns in the rice accessions.
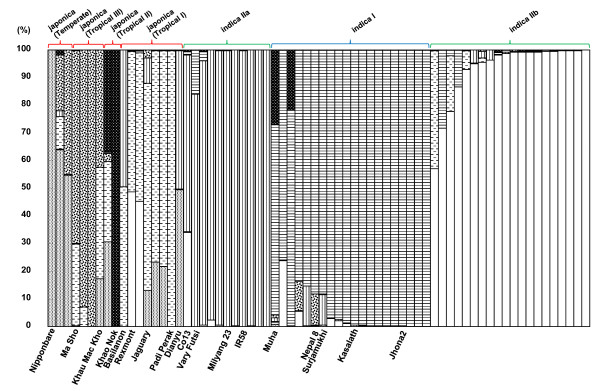
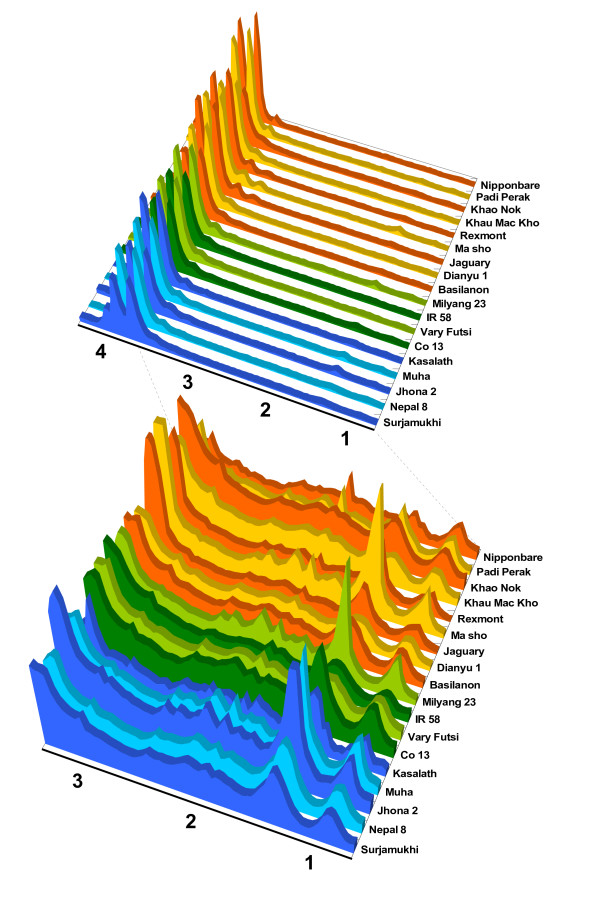
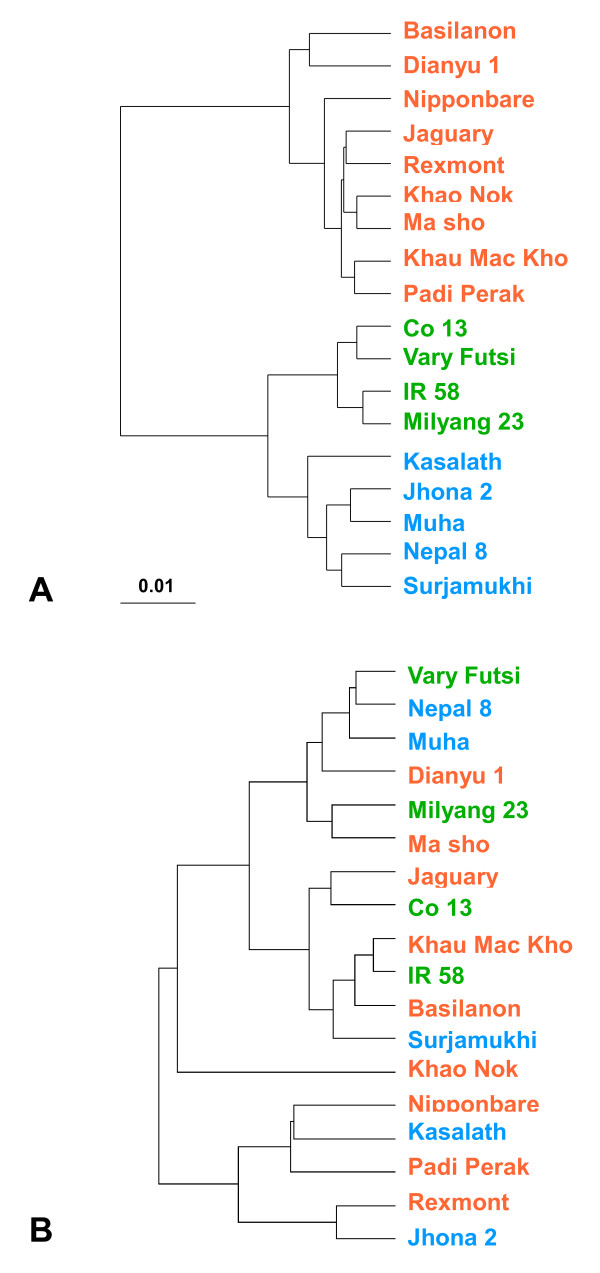
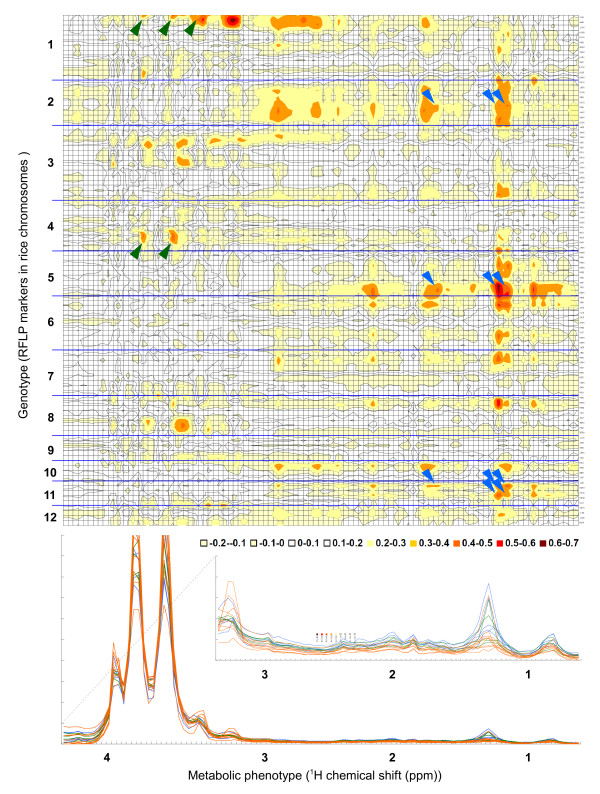
Results: We selected 18 accessions from the world rice collection based on their population structure. To determine the genomic diversity of the rice genome, we genotyped 128 restriction fragment length polymorphism (RFLP) markers to calculate the genetic distance among the accessions. To identify the variations in the metabolic fingerprint, a soluble extract from the seed grain of each accession was analyzed with one dimensional (1)H-nuclear magnetic resonance (NMR). We found no correlation between global metabolic diversity and the phylogenetic relationships among the rice accessions (r(s) = 0.14) by analyzing the distance matrices (calculated from the pattern of the metabolic fingerprint in the 4.29- to 0.71-ppm (1)H chemical shift) and the genetic distance on the basis of the RFLP markers. However, local correlation analysis between the distance matrices (derived from each 0.04-ppm integral region of the (1)H chemical shift) against genetic distance matrices (derived from sets of 3 adjacent markers along each chromosome), generated clear correlations (r(s) > 0.4, p < 0.001) at 34 RFLP markers.
Conclusion: This combinatorial approach will be valuable for exploring the correlative relationships between metabolic and genomic diversity. It will facilitate the elucidation of complex regulatory networks and those of evolutionary significance in plant metabolic systems.
Figures
Similar articles
-
Genome-wide generation and use of informative intron-spanning and intron-length polymorphism markers for high-throughput genetic analysis in rice.Sci Rep. 2016 Apr 1;6:23765. doi: 10.1038/srep23765. Sci Rep. 2016. PMID: 27032371 Free PMC article.
-
Genetic diversity and structure in hill rice (Oryza sativa L.) landraces from the North-Eastern Himalayas of India.BMC Genet. 2016 Jul 13;17(1):107. doi: 10.1186/s12863-016-0414-1. BMC Genet. 2016. PMID: 27412613 Free PMC article.
-
Genomic adaptation of flowering-time genes during the expansion of rice cultivation area.Plant J. 2018 Jun;94(5):895-909. doi: 10.1111/tpj.13906. Epub 2018 Apr 21. Plant J. 2018. PMID: 29570873
-
Genetic differentiation of wild relatives of rice as assessed by RFLP analysis.Theor Appl Genet. 2002 Dec;106(1):101-6. doi: 10.1007/s00122-002-1013-2. Epub 2002 Oct 3. Theor Appl Genet. 2002. PMID: 12582876
-
Diversity of the Ty-1 copia retrotransposon Tos17 in rice (Oryza sativa L.) and the AA genome of the Oryza genus.Mol Genet Genomics. 2009 Dec;282(6):633-52. doi: 10.1007/s00438-009-0493-z. Epub 2009 Oct 25. Mol Genet Genomics. 2009. PMID: 19856189
Cited by
-
ECOMICS: a web-based toolkit for investigating the biomolecular web in ecosystems using a trans-omics approach.PLoS One. 2012;7(2):e30263. doi: 10.1371/journal.pone.0030263. Epub 2012 Feb 1. PLoS One. 2012. PMID: 22319563 Free PMC article.
-
Genomics and bioinformatics resources for crop improvement.Plant Cell Physiol. 2010 Apr;51(4):497-523. doi: 10.1093/pcp/pcq027. Epub 2010 Mar 5. Plant Cell Physiol. 2010. PMID: 20208064 Free PMC article. Review.
-
Exploring molecular backgrounds of quality traits in rice by predictive models based on high-coverage metabolomics.BMC Syst Biol. 2011 Oct 28;5:176. doi: 10.1186/1752-0509-5-176. BMC Syst Biol. 2011. PMID: 22034874 Free PMC article.
-
Advances in omics and bioinformatics tools for systems analyses of plant functions.Plant Cell Physiol. 2011 Dec;52(12):2017-38. doi: 10.1093/pcp/pcr153. Plant Cell Physiol. 2011. PMID: 22156726 Free PMC article. Review.
-
Metabolomic and functional genomic analyses reveal varietal differences in bioactive compounds of cooked rice.PLoS One. 2010 Sep 23;5(9):e12915. doi: 10.1371/journal.pone.0012915. PLoS One. 2010. PMID: 20886119 Free PMC article.
References
Publication types
MeSH terms
Substances
LinkOut - more resources
Full Text Sources
