

Motor-substrate interactions in mycoplasma motility explains non-Arrhenius temperature dependence
- PMID: 19948122
- PMCID: PMC2784561
- DOI: 10.1016/j.bpj.2009.09.020
Motor-substrate interactions in mycoplasma motility explains non-Arrhenius temperature dependence
Abstract
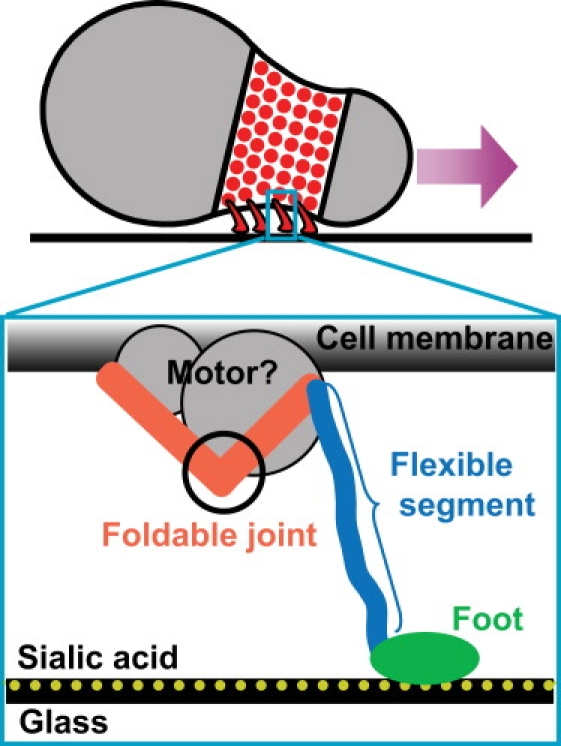
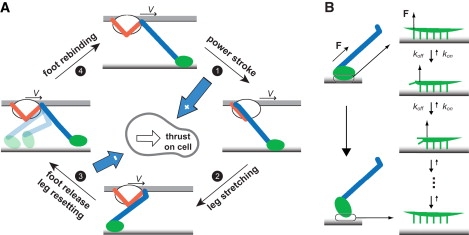
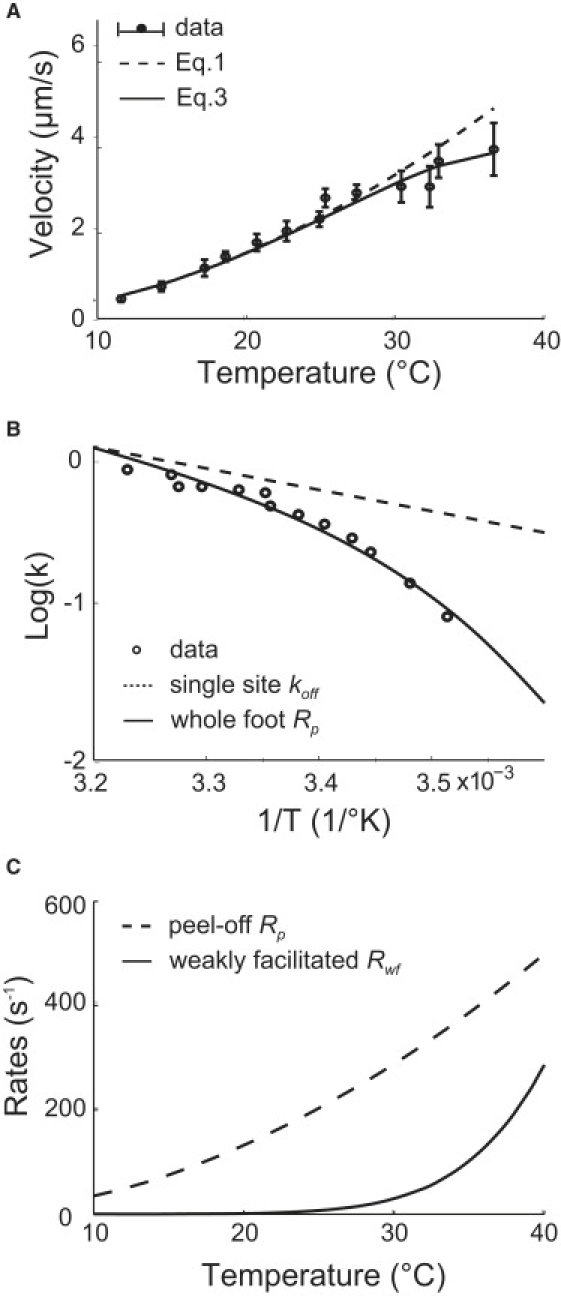
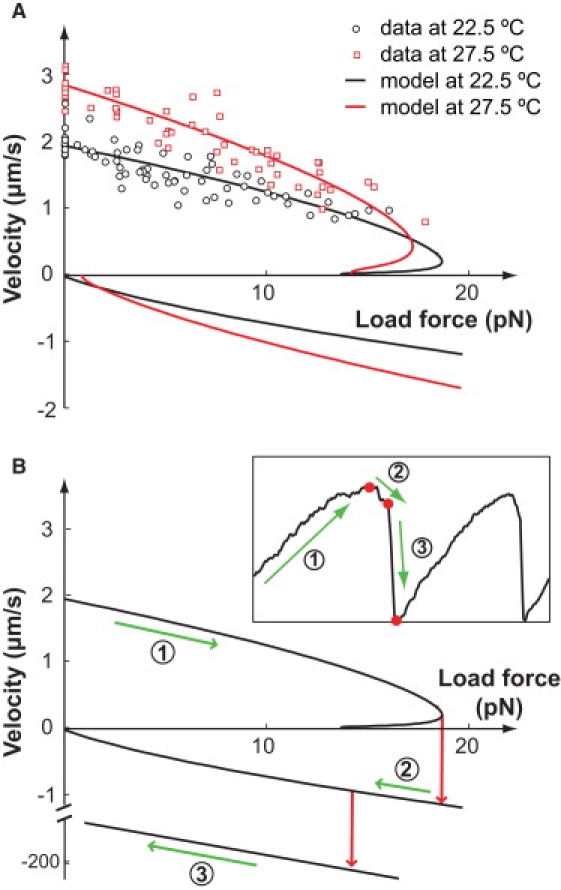
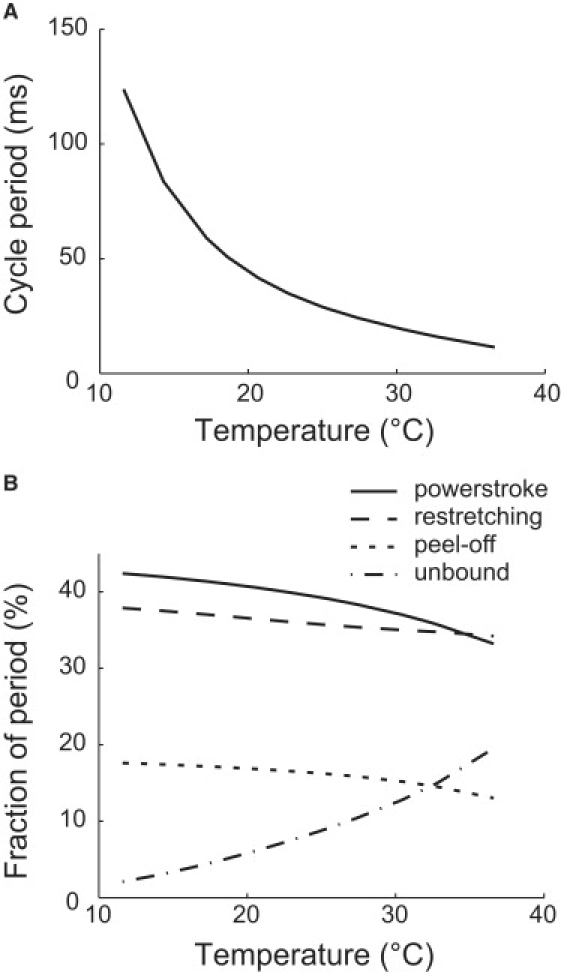
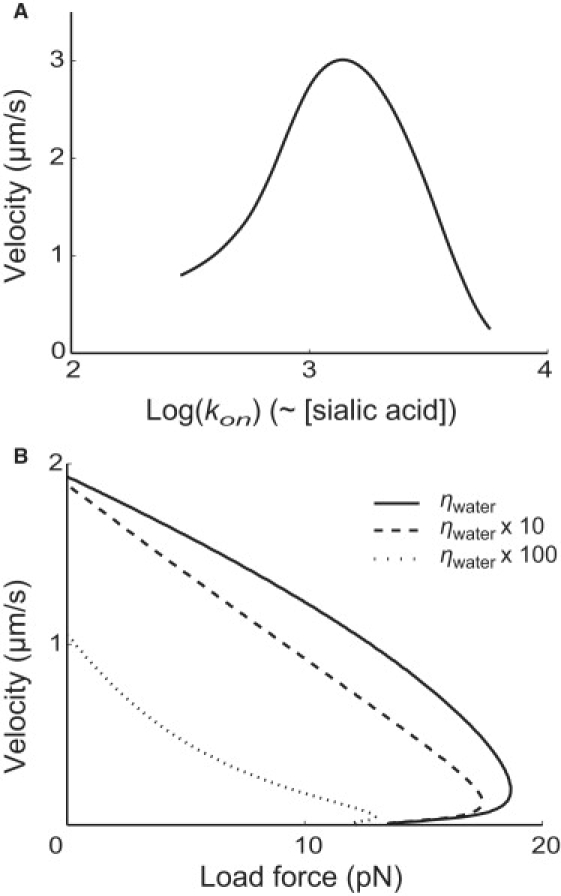
Mycoplasmas exhibit a novel, substrate-dependent gliding motility that is driven by approximately 400 "leg" proteins. The legs interact with the substrate and transmit the forces generated by an assembly of ATPase motors. The velocity of the cell increases linearly by nearly 10-fold over a narrow temperature range of 10-40 degrees C. This corresponds to an Arrhenius factor that decreases from approximately 45 k(B)T at 10 degrees C to approximately 10 k(B)T at 40 degrees C. On the other hand, load-velocity curves at different temperatures extrapolate to nearly the same stall force, suggesting a temperature-insensitive force-generation mechanism near stall. In this article, we propose a leg-substrate interaction mechanism that explains the intriguing temperature sensitivity of this motility. The large Arrhenius factor at low temperature comes about from the addition of many smaller energy barriers arising from many substrate-binding sites at the distal end of the leg protein. The Arrhenius dependence attenuates at high temperature due to two factors: 1), the reduced effective multiplicity of energy barriers intrinsic to the multiple-site binding mechanism; and 2), the temperature-sensitive weakly facilitated leg release that curtails the power stroke. The model suggests an explanation for the similar steep, sub-Arrhenius temperature-velocity curves observed in many molecular motors, such as kinesin and myosin, wherein the temperature behavior is dominated not by the catalytic biochemistry, but by the motor-substrate interaction.
Figures
Similar articles
-
Linear motor driven-rotary motion of a membrane-permeabilized ghost in Mycoplasma mobile.Sci Rep. 2018 Jul 31;8(1):11513. doi: 10.1038/s41598-018-29875-9. Sci Rep. 2018. PMID: 30065251 Free PMC article.
-
Temperature dependence of force, velocity, and processivity of single kinesin molecules.Biochem Biophys Res Commun. 2000 Jun 16;272(3):895-9. doi: 10.1006/bbrc.2000.2856. Biochem Biophys Res Commun. 2000. PMID: 10860848
-
Temperature dependent properties of a kinesin-3 motor protein from Thermomyces lanuginosus.Fungal Genet Biol. 2007 Nov;44(11):1170-9. doi: 10.1016/j.fgb.2007.02.004. Epub 2007 Feb 21. Fungal Genet Biol. 2007. PMID: 17398126
-
Unique centipede mechanism of Mycoplasma gliding.Annu Rev Microbiol. 2010;64:519-37. doi: 10.1146/annurev.micro.112408.134116. Annu Rev Microbiol. 2010. PMID: 20533876 Review.
-
Prospects for the gliding mechanism of Mycoplasma mobile.Curr Opin Microbiol. 2016 Feb;29:15-21. doi: 10.1016/j.mib.2015.08.010. Epub 2015 Oct 21. Curr Opin Microbiol. 2016. PMID: 26500189 Review.
Cited by
-
Movements of Mycoplasma mobile Gliding Machinery Detected by High-Speed Atomic Force Microscopy.mBio. 2021 Jun 29;12(3):e0004021. doi: 10.1128/mBio.00040-21. Epub 2021 May 28. mBio. 2021. PMID: 34044587 Free PMC article.
-
Chained Structure of Dimeric F1-like ATPase in Mycoplasma mobile Gliding Machinery.mBio. 2021 Aug 31;12(4):e0141421. doi: 10.1128/mBio.01414-21. Epub 2021 Jul 20. mBio. 2021. PMID: 34281395 Free PMC article.
-
Localization of P42 and F(1)-ATPase α-subunit homolog of the gliding machinery in Mycoplasma mobile revealed by newly developed gene manipulation and fluorescent protein tagging.J Bacteriol. 2014 May;196(10):1815-24. doi: 10.1128/JB.01418-13. Epub 2014 Feb 7. J Bacteriol. 2014. PMID: 24509320 Free PMC article.
-
Linear motor driven-rotary motion of a membrane-permeabilized ghost in Mycoplasma mobile.Sci Rep. 2018 Jul 31;8(1):11513. doi: 10.1038/s41598-018-29875-9. Sci Rep. 2018. PMID: 30065251 Free PMC article.
-
Role of binding in Mycoplasma mobile and Mycoplasma pneumoniae gliding analyzed through inhibition by synthesized sialylated compounds.J Bacteriol. 2013 Feb;195(3):429-35. doi: 10.1128/JB.01141-12. Epub 2012 Nov 2. J Bacteriol. 2013. PMID: 23123913 Free PMC article.
References
-
- Miyata M. Gliding motility of mycoplasmas: the mechanism cannot be explained by current biology. In: Blanchard A., Browning G., editors. Mycoplasmas: Molecular Biology, Pathogenicity and Strategies for Control. Horizon Bioscience; Wymondham, UK: 2005. pp. 137–163.
-
- Kirchhoff H. Mycoplasmas—Molecular Biology and Pathogenesis. American Society for Microbiology; Washington, DC: 1992. Motility; pp. 289–306.
-
- Rosengarten R., Fisher M., Kirchhoff H., Kerlen G., Seack K.-H. Transport of erythrocytes by gliding cells of Mycoplasma-mobile 163k. Curr. Microbiol. 1988;16:253–257.
MeSH terms
Substances
LinkOut - more resources
Full Text Sources
