. 2010 Feb 15;49(4):3027-38.
doi: 10.1016/j.neuroimage.2009.11.051. Epub 2009 Dec 4.

Modeling hemodynamic responses in auditory cortex at 1.5 T using variable duration imaging acoustic noise

Affiliations

Modeling hemodynamic responses in auditory cortex at 1.5 T using variable duration imaging acoustic noise

Shuowen Hu et al. Neuroimage. .

Abstract

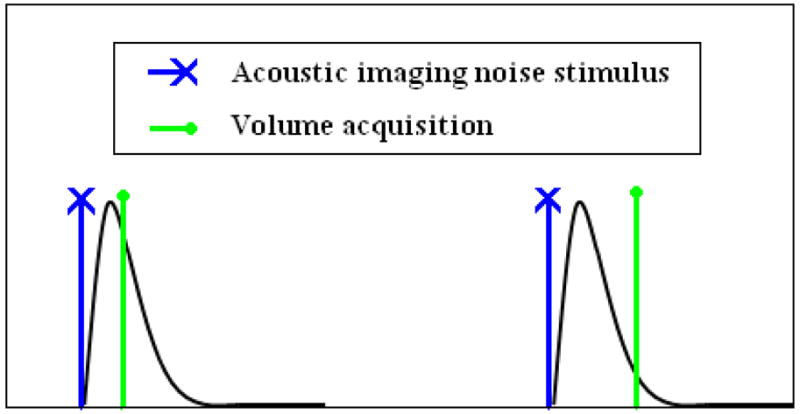
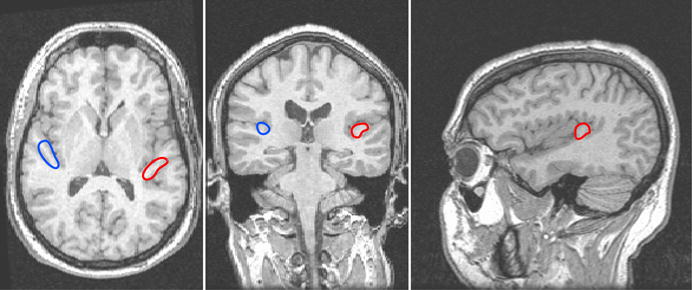
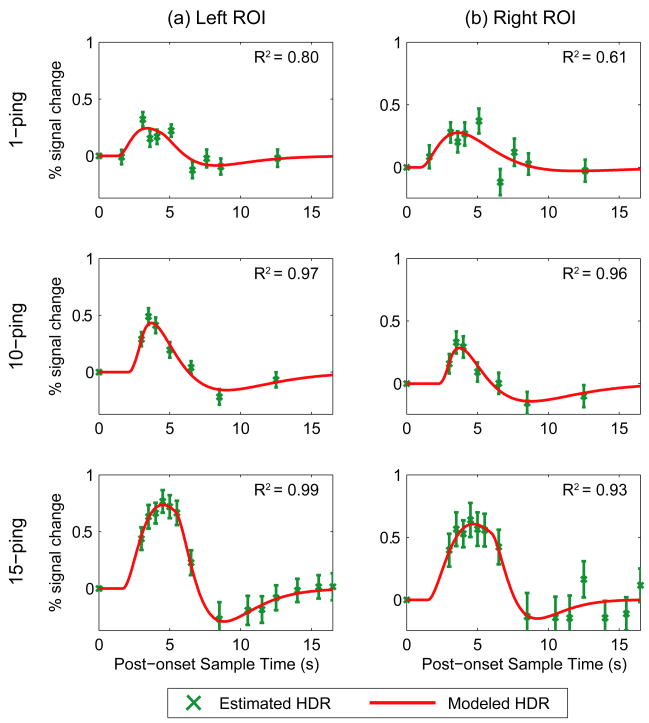
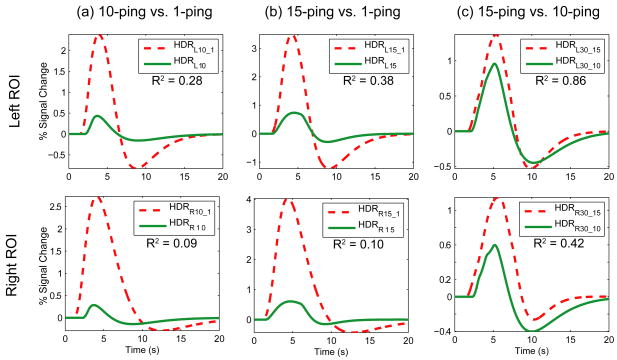
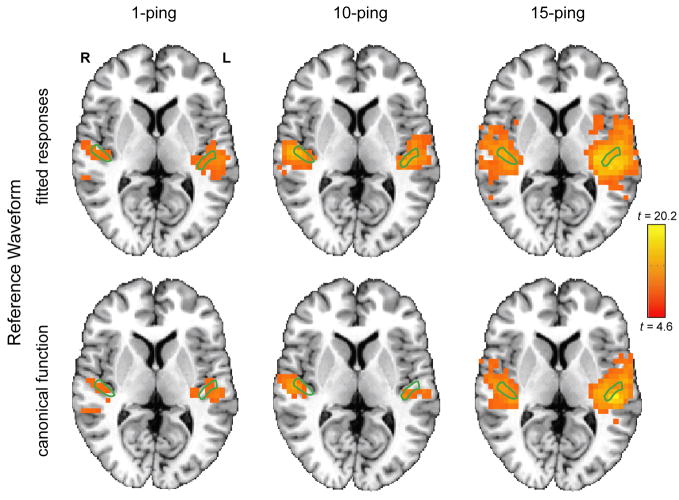
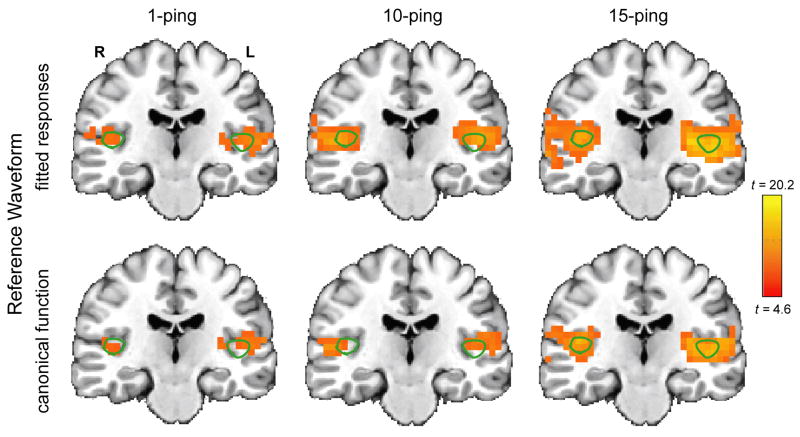
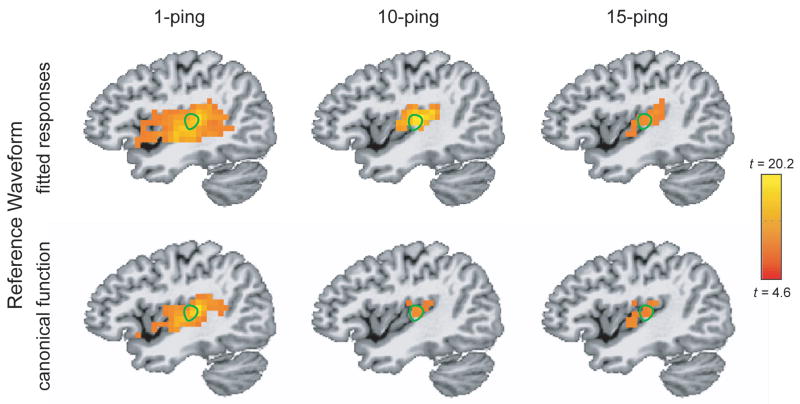
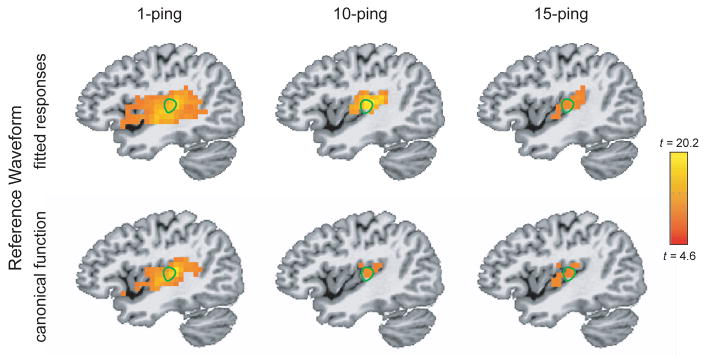
A confound for functional magnetic resonance imaging (fMRI), especially for auditory studies, is the presence of imaging acoustic noise generated mainly as a byproduct of rapid gradient switching during volume acquisition and, to a lesser extent, the radiofrequency transmit. This work utilized a novel pulse sequence to present actual imaging acoustic noise for characterization of the induced hemodynamic responses and assessment of linearity in the primary auditory cortex with respect to noise duration. Results show that responses to brief duration (46 ms) imaging acoustic noise is highly nonlinear while responses to longer duration (>1 s) imaging acoustic noise becomes approximately linear, with the right primary auditory cortex exhibiting a higher degree of nonlinearity than the left for the investigated noise durations. This study also assessed the spatial extent of activation induced by imaging acoustic noise, showing that the use of modeled responses (specific to imaging acoustic noise) as the reference waveform revealed additional activations in the auditory cortex not observed with a canonical gamma variate reference waveform, suggesting an improvement in detection sensitivity for imaging acoustic noise-induced activity. Longer duration (1.5 s) imaging acoustic noise was observed to induce activity that expanded outwards from Heschl's gyrus to cover the superior temporal gyrus as well as parts of the middle temporal gyrus and insula, potentially affecting higher level acoustic processing.


Figures

Figure 1
Figure 1
Illustration of stroboscopic experimental paradigm (e.g., Belin et al., 1999) showing volume acquisitions occurring with a fixed repetition time sampling the hemodynamic response induced by imaging acoustic noise at variable post-offset sample times.
Figure 2
Figure 2
Illustration of manually-selected primary auditory cortex ROI from a subject’s anatomical images. The left ROI is shown in red and the right ROI in blue.
Figure 3
Figure 3
Modeled hemodynamic responses, fit using a double-gamma variate function (red lines; model has six parameters), overlaid with group-averaged estimated hemodynamic response samples (green points; mean ± one standard error) for (a) left and (b) right regions of interest for (top) 1-ping, (middle) 10-ping, and (bottom)15-ping imaging acoustic noise. The coefficient of determination (R2) is a measure of the goodness-of-fit between the double gamma variate model and the estimated hemodynamic response samples.
Figure 4
Figure 4
Linearity assessment of hemodynamic response in the left and right primary auditory cortices to imaging acoustic noise through comparison of modeled hemodynamic responses. (a) 10-ping linear system response (HDR10_1) formed from superposition of 10 successively time-delayed 1-ping responses, overlaid with the fitted 10-ping response (HDR10); (b) 15-ping linear system response (HDR15_1) overlaid with fitted 15-ping response(HDR15); (c) 30-ping linear system response formed from superposition of two 15-ping responses (HDR30_15), overlaid with that formed from superposition of three 10-ping responses (HDR30_10). The coefficient of determination (R2), shown below the legend in each plot, is a measure of the similarity between the linear system response and the fitted response, serving as a metric for the degree of nonlinearity.
Figure 5
Figure 5
Axial activation maps at pBonferroni < 0.05 for (left) 1-ping, (middle) 10-ping, and (right) 15-ping imaging acoustic noise, generated (top) using the fitted responses as the reference waveform and (bottom) using the canonical gamma variate function as the reference waveform. The primary auditory cortex ROI, defined as the medial two-thirds portion of Heschl’s gyrus, is outlined in green.
Figure 6
Figure 6
Coronal activation maps at pBonferroni < 0.05 for (left) 1-ping, (middle) 10-ping, and right) 15-ping imaging acoustic noise, generated (top) using the fitted responses as the reference waveform and (bottom) using the canonical gamma variate function as the reference waveform. The primary auditory cortex ROI, defined as the medial two-thirds portion of Heschl’s gyrus, is shown outlined in green.
Figure 7
Figure 7
Sagittal activation maps in the left hemisphere at pBonferroni < 0.05 for (left) 1-ping, (middle) 10-ping, and (right) 15-ping acoustic imaging noise, generated (top) using the fitted responses as the reference waveform and (bottom) using the canonical gamma variate function as the reference waveform. The primary auditory cortex ROI, defined as the medial two-thirds portion of Heschl’s gyrus, is outlined in green.
Figure 8
Figure 8
Sagittal activation maps in the right hemisphere at pBonferroni < 0.05 for (left) 1-ping, (middle) 10-ping, and (right) 15-ping acoustic imaging noise, generated (top) using the fitted responses as the reference waveform and (bottom) using the canonical gamma variate function as the reference waveform. The primary auditory cortex ROI, defined as the medial two-thirds portion of Heschl’s gyrus, is outlined in green.

Similar articles

Cited by

References

    1. Bamiou DE, Musiek FE, Luxon LM. The insula (Island of Reil) and its role in auditory processing. Literature review. Brain Res Brain Res Rev. 2003;42:143–54. - PubMed
    1. Bandettini PA, Jesmanowicz A, Van Kylen J, Birn RM, Hyde JS. Functional MRI of brain activation induced by scanner acoustic noise. Magn Reson Med. 1998;39:410–416. - PubMed
    1. Barrett DJK, Hall DA. Response preferences for “what” and “where” in human non-primary auditory cortex. NeuroImage. 2007;32:968–977. - PubMed
    1. Boynton GM, Engel SA, Glover GH, Heeger DJ. Linear systems analysis of functional magnetic resonance imaging in human V1. J Neurosci. 1996;16:4207–4221. - PMC - PubMed
    1. Calhoun VD, Stevens MC, Pearlson GD, Kiehl KA. fMRI analysis with the general linear model; removal of latency-induced amplitude bias by incorporation of hemodynamic derivatives terms. NeuroImage. 2004;22:252–257. - PubMed

Publication types