. 2009 Nov 2;187(3):375-84.
doi: 10.1083/jcb.200904140. Epub 2009 Oct 26.

Heterogeneity in the physiological states and pharmacological responses of differentiating 3T3-L1 preadipocytes

Affiliations

Heterogeneity in the physiological states and pharmacological responses of differentiating 3T3-L1 preadipocytes

Lit-Hsin Loo et al. J Cell Biol. .

Abstract

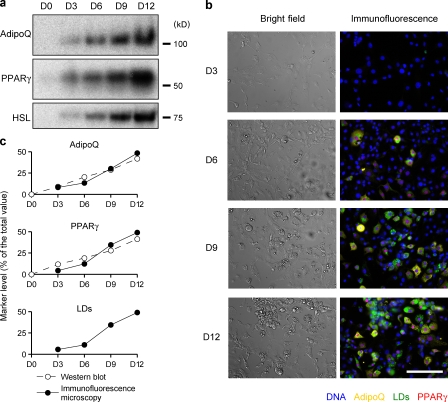
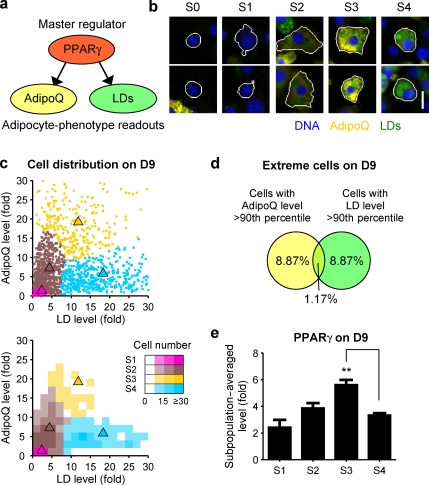
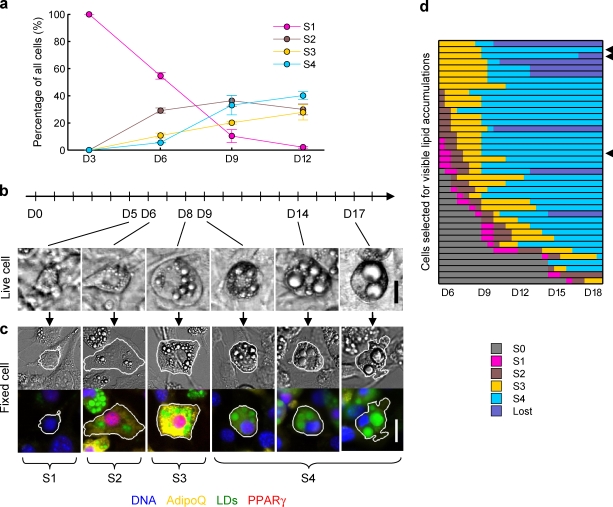
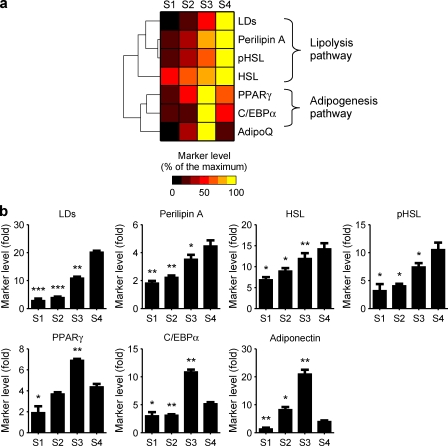
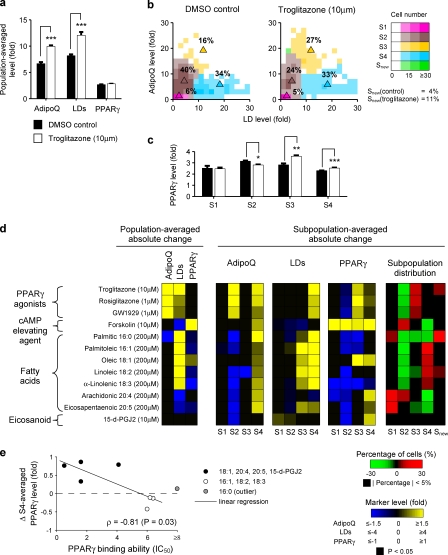
Increases in key components of adipogenesis and lipolysis pathways correlate at the population-averaged level during adipogenesis. However, differentiating preadipocytes are highly heterogeneous in cellular and lipid droplet (LD) morphologies, and the degree to which individual cells follow population-averaged trends is unclear. In this study, we analyze the molecular heterogeneity of differentiating 3T3-L1 preadipocytes using immunofluorescence microscopy. Unexpectedly, we only observe a small percentage of cells with high simultaneous expression of markers for adipogenesis (peroxisome proliferator-activated receptor gamma [PPARgamma], CCAAT/enhancer-binding protein alpha, and adiponectin) and lipid accumulation (hormone-sensitive lipase, perilipin A, and LDs). Instead, we identify subpopulations of cells with negatively correlated expressions of these readouts. Acute perturbation of adipocyte differentiation with PPARgamma agonists, forskolin, and fatty acids induced subpopulation-specific effects, including redistribution of the percentage of cells in observed subpopulations and differential expression levels of PPARgamma. Collectively, our results suggested that heterogeneity observed during 3T3-L1 adipogenesis reflects a dynamic mixture of subpopulations with distinct physiological states.


Figures

Figure 1.
Figure 1.
Population-averaged levels of adipocyte markers increased monotonically on differentiating 3T3-L1 preadipocytes. (a) Western blots of differentiating 3T3-L1 cells probed with antibodies for AdipoQ, PPARγ, and HSL. Equal amounts of proteins were collected from each day of differentiation. For AdipoQ, only the tetramer bands are shown (D0, right before differentiation induction; D3–12, D3–12 after differentiation induction). (b) Bright field differential interference contrast and immunofluorescence images showing differentiating 3T3-L1 cells. For visualization only, marker intensity ranges were equalized across all images. (c) Comparisons of marker levels obtained from Western blots and median cell expression values from immunofluorescence images (see Materials and methods). Each graph was normalized to have unit sum across all days. Bar, 150 µm.
Figure 2.
Figure 2.
Automated clustering identified differentiating 3T3-L1 subpopulations with distinct phenotypes. (a) AdipoQ and LDs were chosen as downstream readouts of PPARγ. (b) Differentiating 3T3-L1 cells from D6–12 (Fig. S1 c) were computationally pooled and clustered based on their AdipoQ and LD levels. Four subpopulations were identified (S1–4). The subpopulation of quiescent cells (S0) was excluded before clustering. Immunofluorescence images of two cells near the centroid of each subpopulation are shown. White lines indicate cell segmentation boundaries. (c) Scatter plot and 2D histogram showing the distribution of 3T3-L1 cells on D9. Triangles indicate centroids for S1–4 in the original subpopulation model. (d) Venn diagram showing the overlap of 3T3-L1 cells with high AdipoQ or LD levels. (e) Subpopulation-averaged levels of PPARγ. Error bars indicate SEM (n = 3); **, P < 0.01 by two-tailed paired t test. Bar, 20 µm.
Figure 3.
Figure 3.
Temporal ordering of the identified 3T3-L1 subpopulations. (a) Changes in the percentages of subpopulations from D3–12. (b) Differentiating 3T3-L1 cells with visible lipid accumulations were tracked for 18 d using live cell phase contrast microscopy. Significant cell morphological changes for one of the 40 tracked cells are shown. Time-lapse videos for this and two other cells are shown in Video 1. (c) Examples of fixed 3T3-L1 cells in differential interference contrast (top) and immunofluorescence (bottom) from D6 to 12 that appeared similar to the cell tracked in b. (d) Bar chart showing the subpopulation assignments for all 40 tracked live cell sequences. Triangles indicate cells shown in Video 1. “Lost” refers to cells that either lost their LDs or disappeared from our view. Error bars indicate SEM (n = 3). Bars, 20 µm.
Figure 4.
Figure 4.
Profiles of the 3T3-L1 subpopulations were extended to include additional key components of the adipogenesis and lipolysis pathways. (a) Heat map showing normalized levels of additional markers for each subpopulation. Marker levels were scaled to their maximum values across all subpopulations. Rows were hierarchically clustered. (b) Pairwise statistical comparisons of marker levels between S4 and all other subpopulations. Error bars indicate SEM (n = 3); *, P < 0.05; **, P < 0.01; ***, P < 0.001 by two-tailed paired t test.
Figure 5.
Figure 5.
Differentiating 3T3-L1 cells responded heterogeneously to external perturbations. Differentiating 3T3-L1 cells were treated with pharmacological and metabolic perturbations for 24 h on D8. (a–c) The effects of either DMSO control or 10 µM troglitazone, as measured by population-averaged marker levels (a), 2D histograms of cell densities (b; triangles indicate centroids for S1–4 in the original subpopulation model; Snew indicates cells with previously unobserved phenotypes), and subpopulation-averaged PPARγ levels (c), are shown. (d) The effects of 12 perturbations were measured by absolute changes in population- and subpopulation-averaged marker levels and subpopulation distributions. Each perturbation had at least three replicates and 300 cells per replicate. (e) PPARγ levels in S4 versus PPARγ-binding abilities for the tested fatty acids and 15-d-PGJ2. Palmitic acid had a half-maximal inhibitory concentration value >30 µM and thus was excluded (ρ, Pearson’s correlation coefficient). Error bars indicate SEM (n = 3); *, P < 0.05; **, P < 0.01; ***, P < 0.001 by two-tailed t test.

Similar articles

Cited by

References

    1. Arita Y., Kihara S., Ouchi N., Takahashi M., Maeda K., Miyagawa J., Hotta K., Shimomura I., Nakamura T., Miyaoka K., et al. 1999. Paradoxical decrease of an adipose-specific protein, adiponectin, in obesity. Biochem. Biophys. Res. Commun. 257:79–83 10.1006/bbrc.1999.0255 - DOI - PubMed
    1. Arner P., Ostman J. 1978. Relationship between the tissue level of cyclic AMP and the fat cell size of human adipose tissue. J. Lipid Res. 19:613–618 - PubMed
    1. Bauche I.B., El Mkadem S.A., Pottier A.M., Senou M., Many M.C., Rezsohazy R., Penicaud L., Maeda N., Funahashi T., Brichard S.M. 2007. Overexpression of adiponectin targeted to adipose tissue in transgenic mice: impaired adipocyte differentiation. Endocrinology. 148:1539–1549 10.1210/en.2006-0838 - DOI - PubMed
    1. Camp H.S., Ren D., Leff T. 2002. Adipogenesis and fat-cell function in obesity and diabetes. Trends Mol. Med. 8:442–447 10.1016/S1471-4914(02)02396-1 - DOI - PubMed
    1. Egan J.J., Greenberg A.S., Chang M.K., Wek S.A., Moos M.C., Jr., Londos C. 1992. Mechanism of hormone-stimulated lipolysis in adipocytes: translocation of hormone-sensitive lipase to the lipid storage droplet. Proc. Natl. Acad. Sci. USA. 89:8537–8541 10.1073/pnas.89.18.8537 - DOI - PMC - PubMed

Publication types