. 2009 Nov 2;187(3):385-98.
doi: 10.1083/jcb.200902039.

Mammalian Rif1 contributes to replication stress survival and homology-directed repair

Affiliations

Mammalian Rif1 contributes to replication stress survival and homology-directed repair

Sara B C Buonomo et al. J Cell Biol. .

Abstract

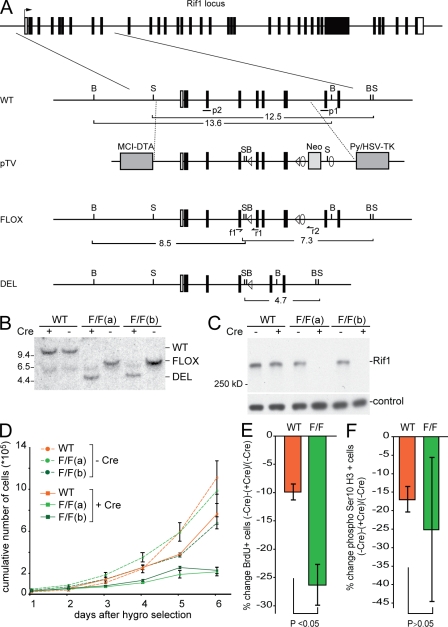
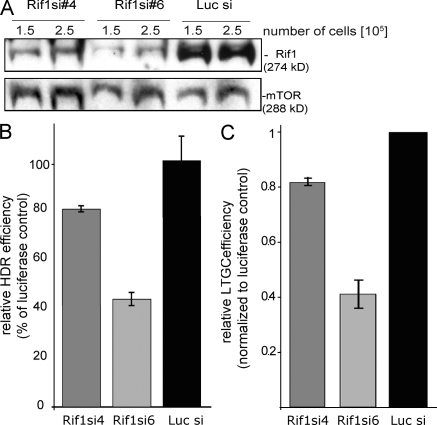
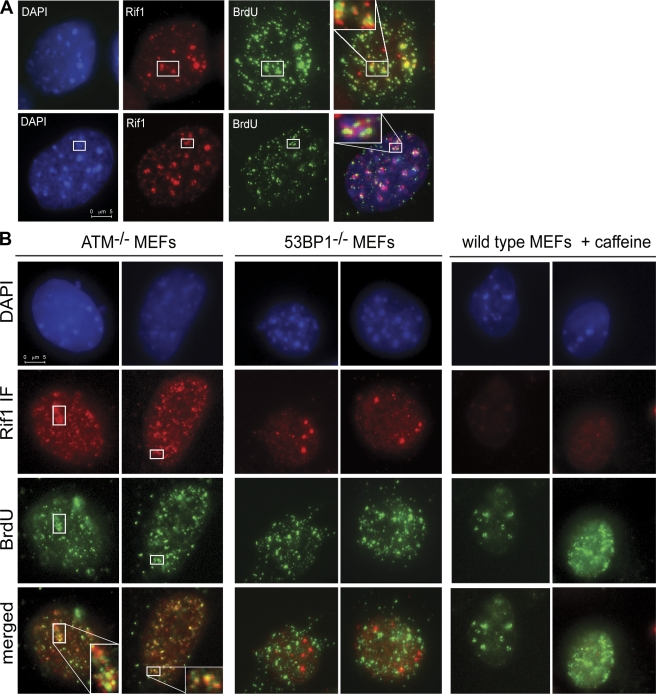
Rif1, originally recognized for its role at telomeres in budding yeast, has been implicated in a wide variety of cellular processes in mammals, including pluripotency of stem cells, response to double-strand breaks, and breast cancer development. As the molecular function of Rif1 is not known, we examined the consequences of Rif1 deficiency in mouse cells. Rif1 deficiency leads to failure in embryonic development, and conditional deletion of Rif1 from mouse embryo fibroblasts affects S-phase progression, rendering cells hypersensitive to replication poisons. Rif1 deficiency does not alter the activation of the DNA replication checkpoint but rather affects the execution of repair. RNA interference to human Rif1 decreases the efficiency of homology-directed repair (HDR), and Rif1 deficiency results in aberrant aggregates of the HDR factor Rad51. Consistent with a role in S-phase progression, Rif1 accumulates at stalled replication forks, preferentially around pericentromeric heterochromatin. Collectively, these findings reveal a function for Rif1 in the repair of stalled forks by facilitating HDR.


Figures

Figure 1.
Figure 1.
Conditional deletion of mouse Rif1 affects cell growth. (A) Schematic diagram of the mouse Rif1 locus, the targeting vector (pTV), the conditional Rif1 allele (FLOX), and the null allele (DEL). LoxP sites (triangles) flank exons 5, 6, and 7. FRT sites (circles) flank the NeoR gene. SacI (S) and BamHI (B) fragment sizes are indicated for each genotype, and the probes p1 and p2 are shown. f1, r1, and r2 are primers for genomic PCR. (B) Southern blots from MEF clones. Genomic DNA digested with SacI and probed with p1. The MEFs were infected with retrovirus carrying either an empty vector (−Cre) or pWZL-Cre (+Cre). Length is indicated in kilobases. (C) Western blot of extracts from MEFs of the indicated genotypes probed with mouse Rif1 antibody 1240. mTOR was used as a loading control. (D) Growth curves of Rif1 wild type (WT) and two independent Rif1F/F (F/F) MEF lines with and without treatment with Cre. (E) Changes in the S-phase index upon infection with Cre determined based on BrdU uptake during a 30-min pulse of asynchronous populations of Rif1-proficient and -deficient cells. The changes were quantified by calculating the percentage of BrdU-positive cells in (−Cre) − (+Cre)/(−Cre). (F) The same quantification as in E was performed for the G2/M cells by staining for histone H3 phospho-Ser10 and FACS analysis. (D–F) Error bars represent SD.
Figure 2.
Figure 2.
Rif1-null cells are hypersensitive to aphidicolin. (A) Representative examples of metaphase chromosomes from wild-type (left) or Rif1F/F (right) cells treated with Cre and aphidicolin. Open arrows indicate chromatid breaks, the closed arrow indicates a fragment, and arrowheads indicate radial chromosomes. (B) Table summarizing chromosome anomalies scored by SKY analysis of metaphase spreads from MEFs of the indicated genotypes. Values in parentheses indicate percentages of chromosomes with the relevant abnormality. aph, aphidicolin. (C and D) Graphs of colony survival of MEFs with the indicated genotypes treated with aphidicolin (C) or MMC (D). Error bars represent SD. Bar, 10 µm.
Figure 3.
Figure 3.
Rif1 deletion causes accumulation of DNA damage. (A and B) Western blotting for the phosphorylation state of Chk1 and -2. MEFs of the indicated genotypes were treated with aphidicolin (A) or analyzed untreated (B). Proteins were extracted and analyzed for total levels of Chk1, Chk1 phosphorylation on Ser345, Chk2 phosphorylation, and levels of cyclin A. As a control, NIH3T3 cells were treated with aphidicolin (aph) or γ-irradiated (IR). (C and D) Cells were treated or not (no APH) with aphidicolin for 3 h and 30 min. The presence of the DNA damage is identified by IF for γ-H2AX and is quantified as the mean intensity of specific signal in the nuclei. The percentage of each cell population that showed a value of mean intensity signal >50 was calculated for each time point. Data represent the mean ± SEM of two independent Rif1F/F + Cre and the mean ± SD of three wild type (WT; Rif1 WT, Rif WT + Cre, and Rif1F/F). (C) Mean intensity of γ-H2AX signal after 3 h and 30 min of aphidicolin (APH) treatment is comparable between wild-type and Rif1-null cells. (D) Time course monitoring the variation of γ-H2AX signal intensity after release from aphidicolin-induced S-phase arrest. Data were plotted as fold induction over time 0 mean value for each clone. Each time point represents the mean value of two independent Rif1F/F + Cre clones and three wild type (Rif1 WT, Rif WT + Cre, and Rif1F/F). The breaks in the lines indicate that the “no APH” is not a time point in a time course but the basal signal level. (E) Rif1GT/GT pMEF and wild-type littermate controls were synchronized in G0 and released in BrdU to monitor S-phase progression. At the indicated time point, cells were collected and analyzed for BrdU content by FACS. One representative experiment out of two is shown.
Figure 4.
Figure 4.
Rif1 promotes HDR. (A and B) Knockdown of Rif1 decreases HDR efficiency. (A) Rif1 levels were reduced by two specific siRNAs, #4 and #6, in U2OS#18. siRNA against luciferase (Luc si) was used as a control. Western blot showing a titration to validate the reduction of Rif1 levels upon treatment with specific siRNAs. mTOR was used as a loading control. (B) Upon DSB induction by I-SceI transfection, HDR was evaluated by quantifying the amount of GFP-positive cells by FACS. The effect on HDR is expressed as the percentage of the luciferase siRNA. P-values are <0.05 for both siRNAs. (C) LTGC efficiency was calculated by counting the number of colonies growing in the presence of blasticidin and normalized for plating efficiency. The effect of LTGC is expressed relative to the luciferase siRNA control. (B and C) Error bars represent SD.
Figure 5.
Figure 5.
Rif1 binds chromatin before and during DNA replication but only seldom colocalizes with the replication fork in mid–late S phase and around pericentromeric heterochromatin. IF on wild-type MEFs for Rif1 (red) and BrdU visualized by denaturing BrdU staining (green). Late G1, early, mid, mid–late, and late S were identified by the BrdU staining pattern. Insets contain enlarged details of the indicated areas.
Figure 6.
Figure 6.
Rif1 localizes to sites of replication stress. (A) IF on wild-type MEFs for Rif1 (red) and ssDNA visualized by nondenaturing BrdU staining (green). The bottom row shows an example of Rif1 localized at stalled replication forks near heterochromatin. (B) Rif1 localization at aphidicolin-induced sites of ssDNA is abolished in 53BP1-null cells and upon caffeine treatment. IF for Rif1 (red) and ssDNA (green) on ATM−/−, 53BP1−/−, and caffeine-treated wild-type MEFs. All cells were treated with aphidicolin. (A and B) Insets contain enlarged details of the indicated areas.
Figure 7.
Figure 7.
Aberrant Rad51 aggregates in Rif1-deficient cells. (A) IF for Rad51 (green) and 53BP1 (red) in Rif1F/F (left) and wild-type (right) MEFs treated with Cre and aphidicolin. Arrowheads point to aberrant Rad51 aggregates. Insets contain enlarged details of the indicated areas. (B) IF for Rad51 (green), Ki67 (red), and DAPI staining (blue) on Rif1F/F MEFs treated with Cre and aphidicolin (aph). (C and D) Quantification of the percentage of Rad51-positive cells (C) and of the percentage of Rad51-positive (pos) cells containing Rad51 large aggregates (D). One representative experiment out of two is shown. wt, wild type.

References

    1. Adams I.R., McLaren A. 2004. Identification and characterisation of mRif1: a mouse telomere-associated protein highly expressed in germ cells and embryo-derived pluripotent stem cells. Dev. Dyn. 229:733–744 10.1002/dvdy.10471 - DOI - PubMed
    1. Adams M.M., Wang B., Xia Z., Morales J.C., Lu X., Donehower L.A., Bochar D.A., Elledge S.J., Carpenter P.B. 2005. 53BP1 oligomerization is independent of its methylation by PRMT1. Cell Cycle. 4:1854–1861 - PubMed
    1. Banerjee S., Myung K. 2004. Increased genome instability and telomere length in the elg1-deficient Saccharomyces cerevisiae mutant are regulated by S-phase checkpoints. Eukaryot. Cell. 3:1557–1566 10.1128/EC.3.6.1557-1566.2004 - DOI - PMC - PubMed
    1. Barlow C., Hirotsune S., Paylor R., Liyanage M., Eckhaus M., Collins F., Shiloh Y., Crawley J.N., Ried T., Tagle D., Wynshaw-Boris A. 1996. Atm-deficient mice: a paradigm of ataxia telangiectasia. Cell. 86:159–171 10.1016/S0092-8674(00)80086-0 - DOI - PubMed
    1. Bianchi A., Shore D. 2008. Molecular biology. Refined view of the ends. Science. 320:1301–1302 10.1126/science.1159104 - DOI - PubMed

Publication types