. 2009 Nov 2;187(3):429-42.
doi: 10.1083/jcb.200904049. Epub 2009 Oct 26.

MCL-1-dependent leukemia cells are more sensitive to chemotherapy than BCL-2-dependent counterparts

Affiliations

MCL-1-dependent leukemia cells are more sensitive to chemotherapy than BCL-2-dependent counterparts

Joslyn K Brunelle et al. J Cell Biol. .

Abstract

Myeloid cell leukemia sequence 1 (MCL-1) and B cell leukemia/lymphoma 2 (BCL-2) are anti-apoptotic proteins in the BCL-2 protein family often expressed in cancer. To compare the function of MCL-1 and BCL-2 in maintaining cancer survival, we constructed complementary mouse leukemia models based on Emu-Myc expression in which either BCL-2 or MCL-1 are required for leukemia maintenance. We show that the principal anti-apoptotic mechanism of both BCL-2 and MCL-1 in these leukemias is to sequester pro-death BH3-only proteins rather than BAX and BAK. We find that the MCL-1-dependent leukemias are more sensitive to a wide range of chemotherapeutic agents acting by disparate mechanisms. In common across these varied treatments is that MCL-1 protein levels rapidly decrease in a proteosome-dependent fashion, whereas those of BCL-2 are stable. We demonstrate for the first time that two anti-apoptotic proteins can enable tumorigenesis equally well, but nonetheless differ in their influence on chemosensitivity.


Figures
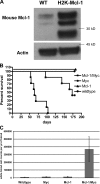
Figure 1.
Figure 1.
MCL-1 overexpression targeted to hematopoietic cells by the H2K promoter in conjunction with c-myc results in the development of leukemia in mice. (A) Levels of MCL-1 protein expression in wild-type and H2K-Mcl-1 mouse spleenocytes. (B) Kaplan-Meier plot showing the survival in number of days for Mcl-1/Eμ-Myc, H2K-Mcl-1 only, Eμ-Myc only, and wild-type mice. This is from a cohort of mice containing seven of each genotype. (C) Number of white blood cells per μl of blood from Mcl-1/Eμ-Myc, H2K-Mcl-1 only, Eμ-Myc only, and wild-type mice. This is from a cohort of mice containing seven of each genotype.
Figure 2.
Figure 2.
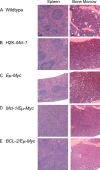
Pathology reveals that the normal architecture of spleen and bone marrow is replaced by a monotonous population of lymphoblasts in Mcl-1/Eμ-Myc mice, similar to BCL-2/Eμ-Myc mice. (A) Wildtype. (B) H2K-Mcl-1 only. (C) Eμ-Myc only. (D) Mcl-1/Eμ-Myc. (E) BCL-2/Eμ-Myc. Bar for the spleen samples is 100 µm, and bar for the bone marrow samples is 50 µm.
Figure 3.
Figure 3.
BH3 profiling distinguishes BCL-2– and MCL-1–dependent leukemias. Each profile is an average and standard deviation of three independent experiments, except for the JC1 whole-cell assay. The JC1 whole-cell assay is one experiment done in triplicate, with the average of the three repeats presented here. (A) BH3 profile of Mcl-1/Eμ-Myc primary leukemia cells. (B) BH3 profile of Mcl-1/Eμ-Myc cell line. (C) BH3 profile of Mcl-1/Eμ-Myc cell line using the JC1 whole-cell assay. (D) BH3 profile of BCL-2/ Eμ-Myc primary leukemia cells. (E) BH3 profile of BCL-2/Eμ-Myc cell line. (F) BH3 profile of BCL-2/Eμ-Myc cell line using the JC1 whole-cell assay. (G) Cell lines were treated with doxycycline for 7 d and survival assessed as the Annexin V negative population, measured by FACS. Data presented are from a single experiment; the experiment was repeated twice.
Figure 4.
Figure 4.
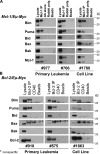
MCL-1 and BCL-2 are primed with BIM and PUMA in leukemia cells. (A) Coimmunoprecipiation of MCL-1 from CHAPS lysate of white blood cell primary sample or cell line from Mcl-1/Eμ-Myc mouse. Blot was probed for BIM, PUMA, BID, BAX, BAK, and MCL-1. (B) Coimmunoprecipiation of BCL-2 from CHAPS lysate of white blood cell primary sample or cell line from BCL-2/Eμ-Myc mouse. Blot was probed for BIM, PUMA, BID, BAX, BAK, and BCL-2.
Figure 5.
Figure 5.
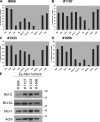
BH3 profiling of Eμ-Myc tumors reveals variable dependence on anti-apoptotic proteins. Data presented are from one single experiment. (A) Eμ-Myc tumor #859 shows a MCL-1 profile. (B) Eμ-Myc tumor #1107 shows a profile where MCL-1 > BCL-2/BCL-XL. (C) Eμ-Myc tumor #1433 shows a profile where MCL-1 > BCL-2/BCL-XL. (D) Eμ-Myc tumor #1656 shows a profile where BCL-2/BCL-XL > MCL-1. (E) Western blot containing CHAPS lysates of the Eμ-Myc tumors in order to compare protein levels of anti-apoptotic proteins BCL-2, BCL-XL, and MCL-1. Note low BCL-2 protein level in Eμ-Myc tumor #859.
Figure 6.
Figure 6.
Higher BIM and PUMA expression observed in MCL-1– and BCL-2–overexpressing leukemias. Western blot comparing protein levels among three Eμ-Myc tumors, two BCL-2/Eμ-Myc leukemias, and three Mcl-1/Eμ-Myc leukemias. (A) The proteins blotted were MCL-1, BCL-2, BIM, PUMA, BID, BAD, BAX, and BAK. Please note that the BCL-2 transgene in the BCL-2/EμMyc lymphomas is human. (B) The proteins blotted were BAD, Phospho-Bad (Ser112), and Actin.
Figure 7.
Figure 7.
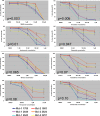
MCL-1–dependent leukemia lines are more sensitive to chemotherapy drugs than BCL-2–dependent leukemia lines. Dose response curves use the following drug treatments: MNNG, Vincristine, Staurosporin, Etoposide, MG132, Fludarabine, Flavopiridol, and Bortezomib. After 24 h of drug treatment, the cells were stained with Annexin/PI and the percentage of viable cells was graphed. Each time point is an average and standard deviation of three independent experiments. For the statistics, the three Mcl-1 cell lines and the three Bcl-2 cell lines were averaged and area under the curve was determined. P value was analyzed by using a paired t test of area under the curve.
Figure 8.
Figure 8.
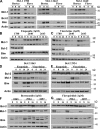
Varied chemotherapeutics induce MCL-1 before cell death. All cell lines pretreated with 20 μM of caspase inhibitor Q-VD-OPH for 1 h. CHAPS lysates were prepared and MCL-1, BCL-2, BIM, and Actin protein levels were determined using Western blotting. (A) Mcl-1/Eμ-Myc cell lines treated with 1 μM Bortezomib or 1 μM Flavopiridol for 0, 8, and 16 h. (B) Mcl-1/Eμ-Myc cell lines treated with 1 μM Etoposide for 0, 8, 16, and 24 h. (C) Mcl-1/Eμ-Myc cell lines treated with 1 μM Vincristine for 0, 8, 16, and 24 h. (D and E) BCL-2/Eμ-Myc cell lines treated with 1 μM Etoposide or 1 μM Vincristine for 0, 8, 16, and 24 h. (F) BCL-2/Eμ-Myc cell lines treated with 1 μM Bortezomib for 0, 8, and 16 h. (G) BCL-2/Eμ-Myc cell lines treated with 1 μM Flavopiridol for 0, 8, and 16 h.
Figure 9.
Figure 9.
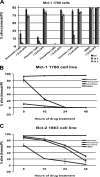
The Mcl-1/Eμ-Myc cell line dies faster than the BCL-2/Eμ-Myc cell line. (A) Annexin/PI measurement used to determine cell viability of Mcl-1/Eμ-Myc cell line using Etoposide, Flavopiridol, Vincristine, and DMSO drug treatments with and without 20 μM Q-VD-OPH. Data presented are an average and standard deviation of three independent experiments. (B) Dose-response curve of Mcl-1/Eμ-Myc cell line treated with 1 μM of Etoposide, Flavopiridol, or Vincristine over 8, 16, 24, and 48 h. Data presented are an average and standard deviation of three independent experiments. (C) Dose-response curve of BCL-2/Eμ-Myc cell line treated with 1 μM Etoposide, Flavopiridol, or Vincristine over 8, 16, 24, and 48 h. Data presented are an average and standard deviation of three independent experiments.
Figure 10.
Figure 10.
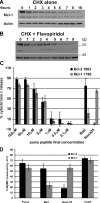
MCL-1 half-life is unchanged by flavopiridol treatment; MCL-1– and BCL-2–dependent mitochondria demonstrate equivalent pretreatment “priming.” (A) A Mcl-1/Eμ-Myc cell line pretreated with 20 μM of caspase inhibitor Q-VD-OPH for 1 h, followed by treatment with 20 μM cycloheximide (CHX). CHAPS lysates were made after each hour of treatment. (B) A Mcl-1/Eμ-Myc cell line pretreated with 20 μM of caspase inhibitor Q-VD-OPH for 1 h, followed by a combined treatment with 20 μM cycloheximide (CHX) and 1 μM Flavopiridol. CHAPS lysates were made after each hour of treatment. (C) BH3 profiling of a Mcl-1/Eμ-Myc and BCL-2/Eμ-Myc cell line using decreasing concentrations of the PUMA peptide. BAD and NOXA peptides were included as controls. Three independent experiments were averaged. (D) BH3 profiling by the whole-cell JC1 method at the 60-min time point. The results of the three Bcl-2 cell lines and three Mcl-1 cell lines were averaged for the following peptides: Puma, Bad, Noxa25, and FCCP.

References

    1. Adams J.M., Harris A.W., Pinkert C.A., Corcoran L.M., Alexander W.S., Cory S., Palmiter R.D., Brinster R.L. 1985. The c-myc oncogene driven by immunoglobulin enhancers induces lymphoid malignancy in transgenic mice. Nature. 318:533–538 10.1038/318533a0 - DOI - PubMed
    1. Beverly L.J., Varmus H.E. 2009. MYC-induced myeloid leukemogenesis is accelerated by all six members of the antiapoptotic BCL family. Oncogene. 28:1274–1279 10.1038/onc.2008.466 - DOI - PMC - PubMed
    1. Bissonnette R.P., Echeverri F., Mahboubi A., Green D.R. 1992. Apoptotic cell death induced by c-myc is inhibited by bcl-2. Nature. 359:552–554 10.1038/359552a0 - DOI - PubMed
    1. Brunelle J.K., Santore M.T., Budinger G.R., Tang Y., Barrett T.A., Zong W.X., Kandel E., Keith B., Simon M.C., Thompson C.B., et al. 2004. c-Myc sensitization to oxygen deprivation-induced cell death is dependent on Bax/Bak, but is independent of p53 and hypoxia-inducible factor-1. J. Biol. Chem. 279:4305–4312 10.1074/jbc.M312241200 - DOI - PubMed
    1. Certo M., Del Gaizo Moore V., Nishino M., Wei G., Korsmeyer S., Armstrong S.A., Letai A. 2006. Mitochondria primed by death signals determine cellular addiction to antiapoptotic BCL-2 family members. Cancer Cell. 9:351–365 10.1016/j.ccr.2006.03.027 - DOI - PubMed

Publication types

MeSH terms