. 2009 Nov 16;187(4):481-96.
doi: 10.1083/jcb.200907029.

Quantitative analysis of chromatin compaction in living cells using FLIM-FRET

Affiliations

Quantitative analysis of chromatin compaction in living cells using FLIM-FRET

David Llères et al. J Cell Biol. .

Abstract

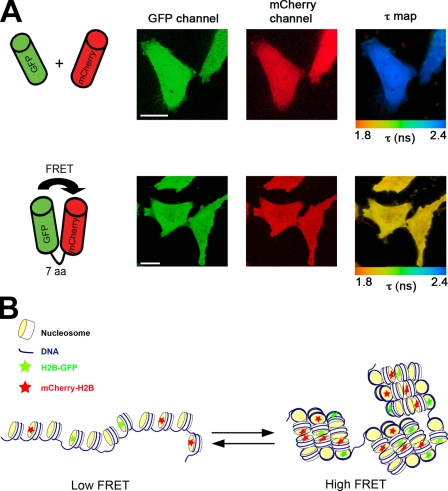
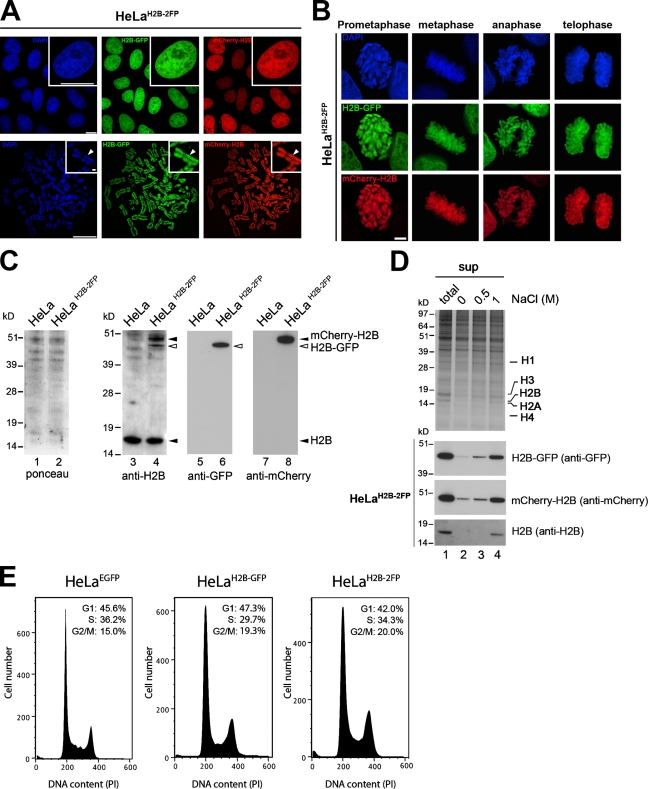
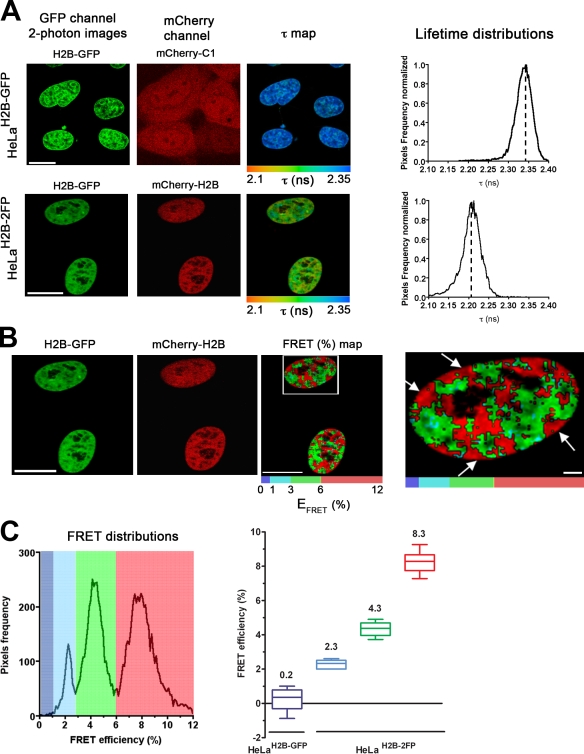
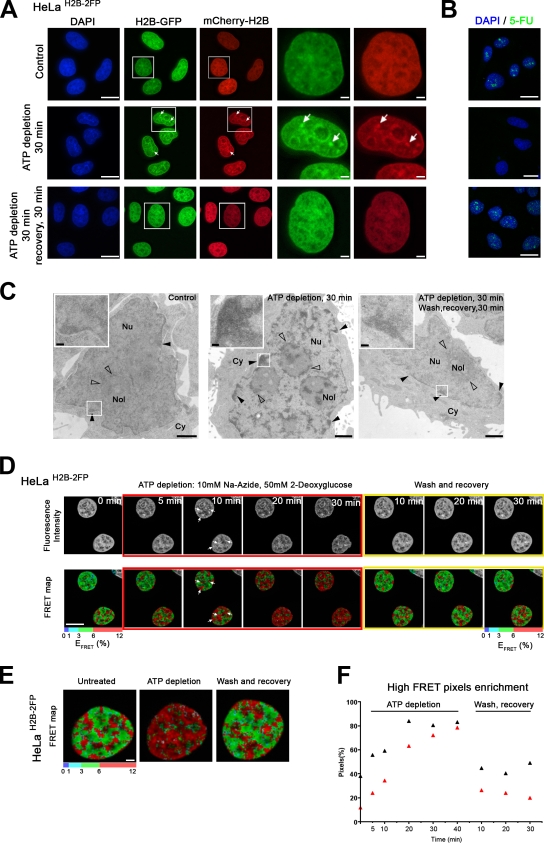
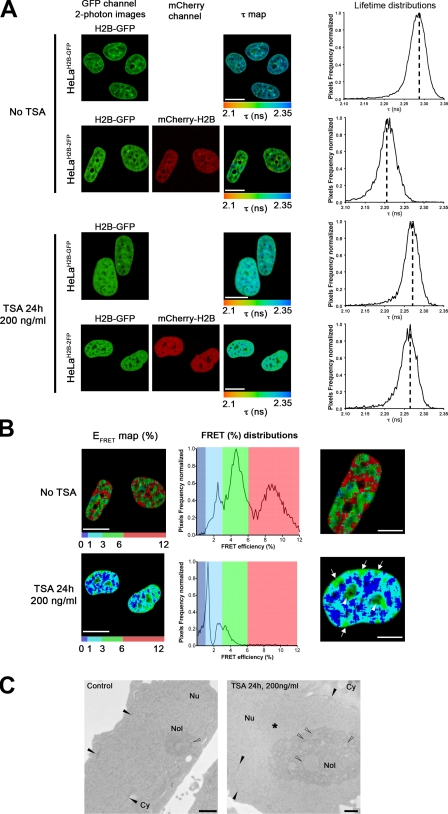
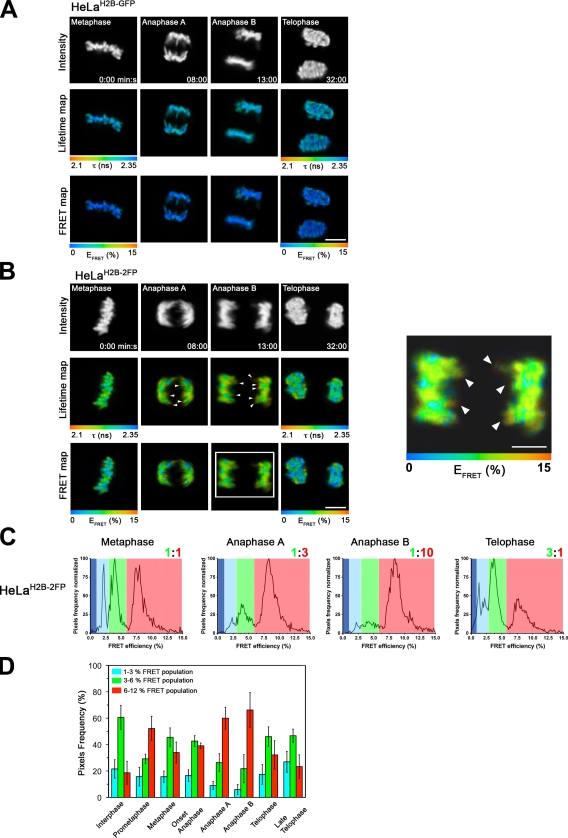
We present a quantitative Förster resonance energy transfer (FRET)-based assay using multiphoton fluorescence lifetime imaging microscopy (FLIM) to measure chromatin compaction at the scale of nucleosomal arrays in live cells. The assay uses a human cell line coexpressing histone H2B tagged to either enhanced green fluorescent protein (FP) or mCherry FPs (HeLa(H2B-2FP)). FRET occurs between FP-tagged histones on separate nucleosomes and is increased when chromatin compacts. Interphase cells consistently show three populations of chromatin with low, medium, or high FRET efficiency, reflecting spatially distinct regions with different levels of chromatin compaction. Treatment with inhibitors that either increase chromatin compaction (i.e., depletion of adenosine triphosphate) or decrease chromosome compaction (trichostatin A) results in a parallel increase or decrease in the FLIM-FRET signal. In mitosis, the assay showed variation in compaction level, as reflected by different FRET efficiency populations, throughout the length of all chromosomes, increasing to a maximum in late anaphase. These data are consistent with extensive higher order folding of chromatin fibers taking place during anaphase.


Figures

Figure 1.
Figure 1.
In vivo FLIM–FRET assay for chromatin compaction. (A) HeLa cells coexpressing either free EGFP and mCherry (top) or EGFP-fused to mCherry through a 7-aa linker (bottom) were imaged by multiphoton laser-scanning microscopy (MPLSM). The spatial distribution of the mean fluorescence lifetime of the EGFP donor (τ map) is displayed using a continuous pseudocolor scale ranging from 1.8 to 2.4 ns. (B) Representation of the FLIM–FRET chromatin compaction assay. Bars, 10 µm.
Figure 2.
Figure 2.
A stable HeLaH2B-2FP cell line coexpressing H2B-EGFP and mCherry-H2B histones. (A) Fluorescent-tagged H2B histones in HeLaH2B-2FP cells imaged by wide-field fluorescence microscopy in interphase (top) and metaphase spreads (bottom). Insets show high magnification views. Arrowheads indicate concentrated heterochromatin in the chromosome, which was brightly stained with DAPI. (B) High resolution imaging of HeLaH2B-2FP cells at different stages of mitosis. (C) Total cell lysates from HeLa and HeLaH2B-2FP cells analyzed by PAGE and Western blotting with antibodies against H2B (lanes 3 and 4), GFP (lanes 5 and 6), or mCherry (lanes 7 and 8). (D) Salt extraction of histones from HeLaH2B-2FP cells. Proteins either from whole cells (total; lane 1) or the supernatant fractions from 0, 0.5, and 1 M NaCl salt extractions of chromatin (sup; lanes 2–4) were separated on SDS-PAGE gels and either stained with Coomassie blue (top) or blotted and probed with the indicated antibodies. (E) FACS analyses showing cell cycle distribution of HeLaEGFP, HeLaH2B-GFP, and HeLaH2B-2FP stable cell lines. Bars, 10 µm.
Figure 3.
Figure 3.
FLIM–FRET measurements spatially discriminate differential chromatin compaction levels in vivo. (A) HeLaH2B-GFP stable cell line transiently transfected with mCherry-C1 empty vector (top) and HeLaH2B-2FP stable cell line (bottom) were imaged using MPLSM. In both cases, the mean fluorescence lifetime τ (nanoseconds) is detected, and its spatial distribution at each pixel of the ROI (τ map) is shown as described in Materials and methods. Fluorescence lifetimes are presented in a continuous pseudocolor scale representing time values ranging from 2.1 to 2.35 ns. The mean lifetime distribution curves of the donor (H2B-GFP) are shown on the right. Dashed lines mark the position of the peaks of the lifetime distribution curves. (B) The FRET efficiency (percentage) and its spatial distribution (FRET (%) map) are depicted in the ROI using discrete colors (see Materials and methods). The ROI comprised the interphase nuclei; the right panel shows a higher magnification of a nucleus (boxed area) revealing high FRET areas at the nuclear periphery (arrows). (C) FRET distributions graph showing three distinct populations distinguished using discrete pseudocolors: blue (low), FRET efficiency up to 3%; green (medium), between 3–6%; and red (high), 6–12%. The statistical analysis of at least 10 cells per condition is presented as box and whisker plots on the right. The three distinct FRET efficiency populations detected in interphase HeLaH2B-2FP cells are represented by colored boxes (i.e., low [blue], medium [green], and high [red] FRET populations, respectively). The mean FRET efficiency value is indicated on top of each box. Bars, 10 µm.
Figure 4.
Figure 4.
ATP levels reversibly alter the chromatin compaction balance. (A) Effects of ATP depletion on chromatin organization. HeLaH2B-2FP cells were imaged, and the distribution of both H2B-EGFP (green)– and mCherry-H2B (red)–tagged histones before and after 30 min ATP depletion or after subsequent washing away of inhibitors after the 30-min depletion followed by a 30-min recovery was addressed. Arrows indicate dense chromatin regions after ATP depletion. The boxed areas delineate particular ROIs in the field of cells, which are magnified in the panels to the right. (B) Transcription assay using 5-FU incorporation. Images show micrographs of HeLa cells pulse labeled for 30 min with 5-FU and immunolabeled with a mouse anti-BrdU antibody to visualize nascent transcripts either before (top) or after 30 min of ATP depletion (middle) or after subsequent washing and recovery for 30 min (bottom). (C) TEM micrographs of HeLa cells before and after ATP depletion. Untreated control cells (left), HeLa cells ATP depleted for 30 min (middle), and HeLa cells after 30-min ATP depletion followed by washing and recovery for 30 min (right) are shown. Closed arrowheads indicate heterochromatin at the nuclear periphery, and open arrowheads indicate heterochromatin around the nucleolus (Nol). Insets show higher magnification of ROIs in the field of cells (boxed areas). Cy, cytoplasm; Nu, nucleus. (D) Time-lapse FLIM–FRET measurements on HeLaH2B-2FP cells during ATP depletion and recovery. The red boundaries surround micrographs showing HeLaH2B-2FP cells at 5–30 min after ATP depletion, and the yellow boundaries surround micrographs showing HeLaH2B-2FP cells during 10–30 min of recovery. The top panels show MPLSM images of H2B-EGFP fluorescence, and the bottom panels show the calculated FRET efficiency (percentage) over time in the selected ROI. In this case, the ROI includes the two interphase nuclei. Arrows indicate high FRET levels. (E) High magnification views of micrographs showing the spatial distribution of FRET efficiency. (F) Graph showing the time course of enrichment in high FRET pixels (red pixels) of two individual cells during ATP depletion and recovery (see Materials and methods). Bars: (A, B, D, and E) 10 µm; (C) 1 µm; (C, insets) 0.1 µm.
Figure 5.
Figure 5.
FLIM–FRET analysis of TSA-induced changes in higher order chromatin organization. (A) The spatial distribution of the mean fluorescence lifetime (τ map) in the ROI is shown for both HeLaH2B-GFP and HeLaH2B-2FP stable cell lines before and after 24-h treatment with 200 ng/ml TSA. In each panel, the ROI comprised the interphase nuclei. Dashed lines mark the position of the peaks of the lifetime distribution curves. (B) EFRET map (percentage) of an ROI comprising two HeLaH2B-2FP nuclei before and after TSA treatment. The FRET distribution graphs are depicted using discrete colors, with the highest FRET population in red, intermediate population in green, and the lowest population in blue. Highest FRET values after TSA treatment are shown at nucleoli (arrowheads) and at the nuclear periphery (arrows). (C) TEM micrographs of HeLa cells before and after TSA treatment. Control untreated HeLa cells (left) and HeLa cells treated with 200 ng/ml TSA for 24 h (right) are shown. The heterochromatin at the nuclear periphery and associated to nucleoli are indicated by closed and open arrowheads, respectively. The asterisk represents bulk decondensed chromatin. Cy, cytoplasm; Nol, nucleolus; Nu, nucleus. Bars: (A and B) 10 µm; (C) 1 µm.
Figure 6.
Figure 6.
FLIM–FRET analysis of chromosome compaction during mitosis. (A) Time-lapse FLIM–FRET measurements of HeLaH2B-GFP cells at different stages of mitosis. (top) Fluorescence intensity of the donor H2B-EGFP. The spatial map of the mean lifetime (middle) and the FRET percentage (bottom) are shown at the indicated stages of mitosis. At each stage of mitosis, the FRET percentage is depicted for a selected ROI (e.g., metaphasic equatorial plate in metaphase, the two separate paired chromosomes in early and late anaphase, or the two daughter nuclei at telophase). (B) Time-lapse FLIM–FRET of HeLaH2B-2FP cells during mitosis. (top) Fluorescence intensity of the donor H2B-EGFP. (middle) Fluorescence lifetime map. (bottom) FRET percentage map. At each stage of mitosis, the FRET percentage is depicted for a particular ROI (e.g., metaphasic equatorial plate in metaphase, the two separate paired chromosomes in early and late anaphase, or the two daughter nuclei at telophase). A higher magnification view of the FRET efficiency in anaphase B (boxed area) is shown in the right panel, with arrowheads indicating localized high FRET at the extremities of chromosome arms. (C) Quantification of the levels of FRET percentage efficiency populations during mitosis (see Materials and methods). A discrete color is associated to each distinct FRET population (low, blue; middle, green; high, red). The ratio between the medium and high FRET population is indicated. (D) Colored histogram showing the relative fraction of the three distinct FRET efficiency populations in interphase and at different stages of mitosis. Error bars indicate SD. Bars, 10 µm.

Similar articles

Cited by

References

    1. Bastiaens P.I., Squire A. 1999. Fluorescence lifetime imaging microscopy: spatial resolution of biochemical processes in the cell. Trends Cell Biol. 9:48–52 10.1016/S0962-8924(98)01410-X - DOI - PubMed
    1. Becker W. 2005. The bh TCSPC handbook. Becker and Hickl GmbH. http://www.becker-hickl.de/handbook.htm(accessed November 27, 2007)
    1. Belmont A.S., Dietzel S., Nye A.C., Strukov Y.G., Tumbar T. 1999. Large-scale chromatin structure and function. Curr. Opin. Cell Biol. 11:307–311 10.1016/S0955-0674(99)80041-6 - DOI - PubMed
    1. Choi J.K., Howe L.J. 2009. Histone acetylation: truth of consequences? Biochem. Cell Biol. 87:139–150 10.1139/O08-112 - DOI - PubMed
    1. Cushman I., Stenoien D., Moore M.S. 2004. The dynamic association of RCC1 with chromatin is modulated by Ran-dependent nuclear transport. Mol. Biol. Cell. 15:245–255 10.1091/mbc.E03-06-0409 - DOI - PMC - PubMed

Publication types