. 2010 Feb 1;588(Pt 3):399-421.
doi: 10.1113/jphysiol.2009.181172. Epub 2009 Nov 30.

Calcium activity in different classes of myenteric neurons underlying the migrating motor complex in the murine colon

Affiliations

Calcium activity in different classes of myenteric neurons underlying the migrating motor complex in the murine colon

Peter O Bayguinov et al. J Physiol. .

Abstract

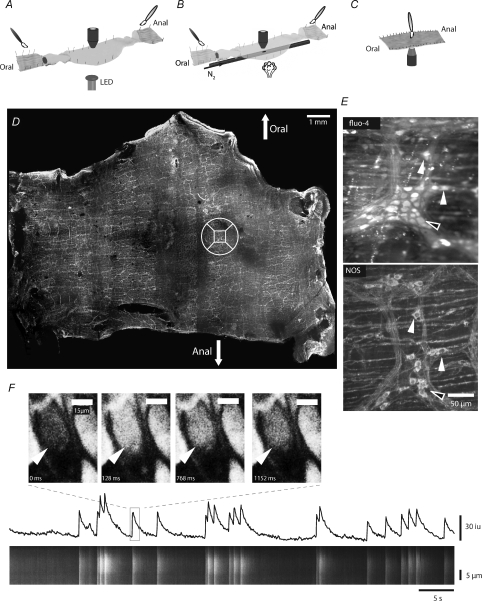
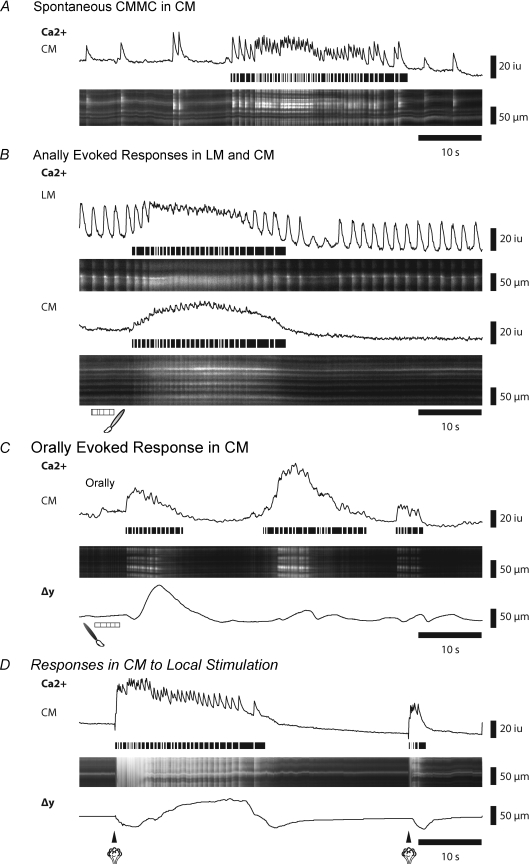
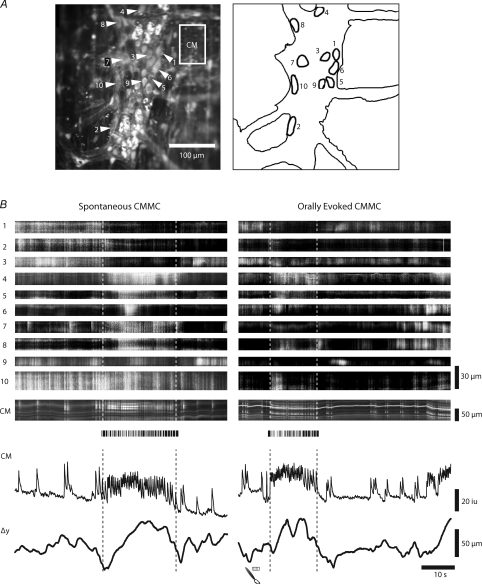
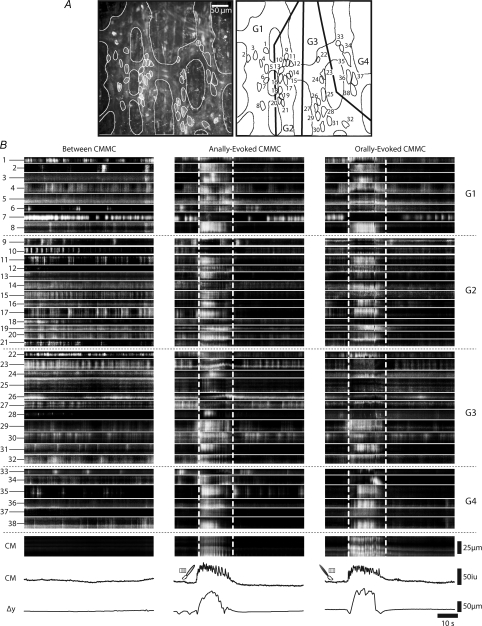
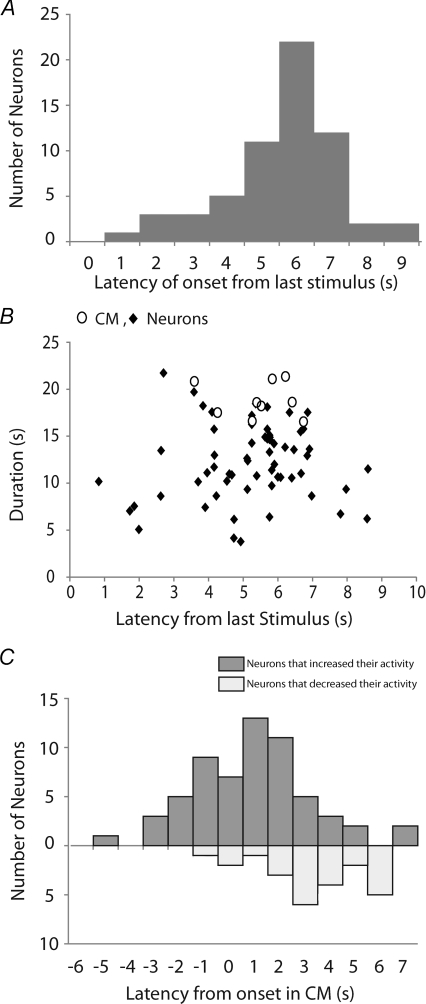
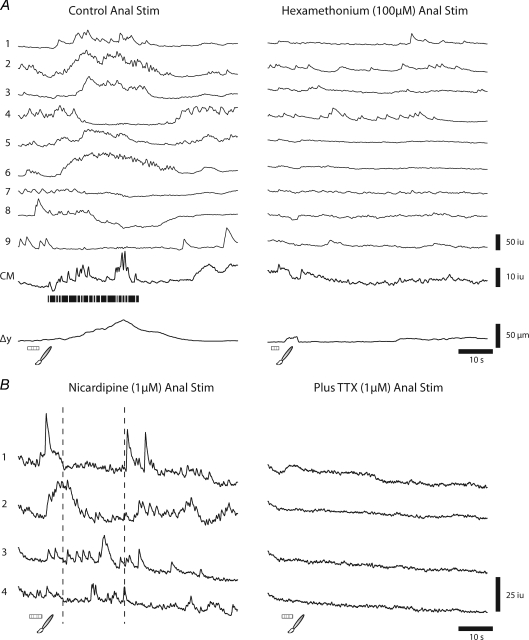
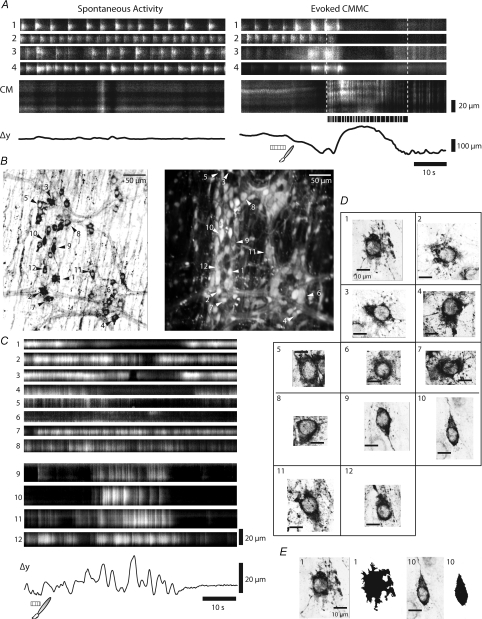
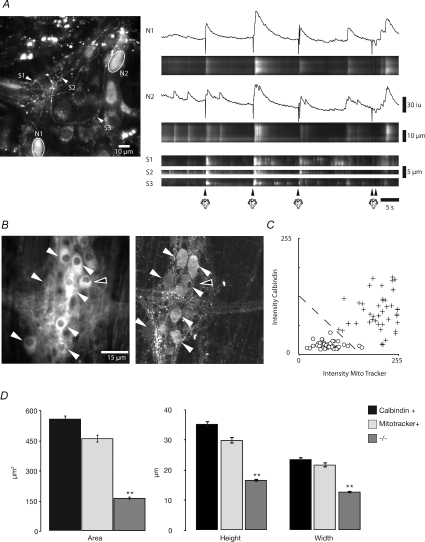
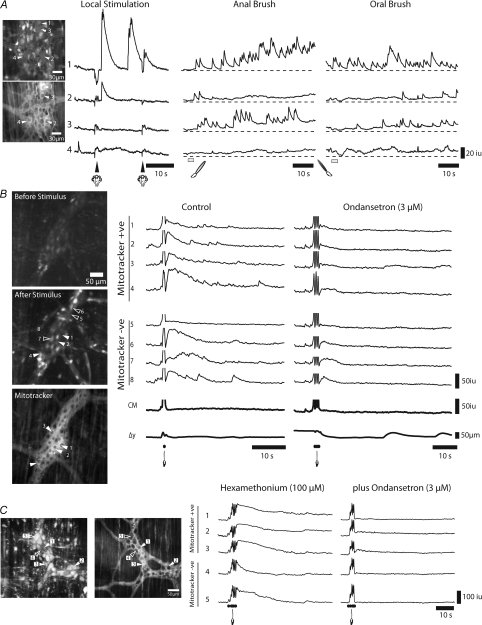
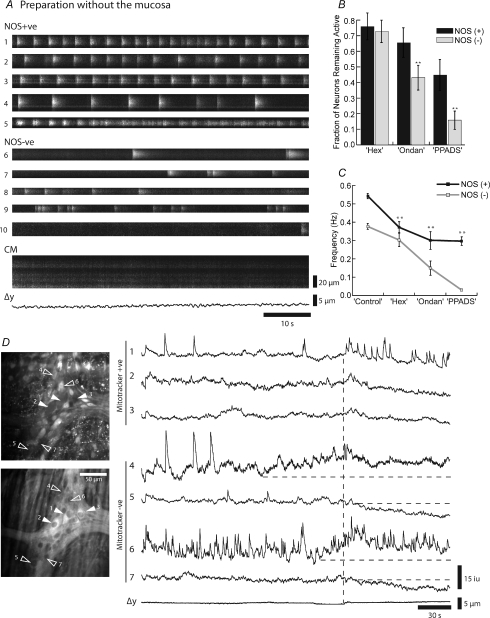
The spontaneous colonic migrating motor complex (CMMC) is a cyclical contractile and electrical event that is the primary motor pattern underlying fecal pellet propulsion along the murine colon. We have combined Ca(2+) imaging with immunohistochemistry to determine the role of different classes of myenteric neurons during the CMMC. Between CMMCs, myenteric neurons usually displayed ongoing but uncoordinated activity. Stroking the mucosa at the oral or anal end of the colon resulted in a CMMC (latency: 6 to 10 s; duration: 28 s) that consisted of prolonged increases in activity in many myenteric neurons that was correlated to Ca(2+) transients in and displacement of the muscle. These neurons were likely excitatory motor neurons. Activity in individual neurons during the CMMC was similar regardless of whether the CMMC occurred spontaneously or was evoked by anal or oral mucosal stimulation. This suggests that convergent interneuronal pathways exist which generate CMMCs. Interestingly, Ca(2+) transients in a subset of NOS +ve neurons were substantially reduced during the CMMC. These neurons are likely to be inhibitory motor neurons that reduce their activity during a complex (disinhibition) to allow full excitation of the muscle. Local stimulation of the mucosa evoked synchronized Ca(2+) transients in Dogiel Type II (mitotracker/calbindin-positive) neurons after a short delay (1-2 s), indicating they were the sensory neurons underlying the CMMC. These local responses were observed in hexamethonium, but were blocked by ondansetron (5-HT(3) antagonist), suggesting Dogiel Type II neurons were activated by 5-HT release from enterochromaffin cells in the mucosa. In fact, removal of the mucosa yielded no spontaneous CMMCs, although many neurons (NOS +ve and NOS ve) exhibited ongoing activity, including Dogiel Type II neurons. These results suggest that spontaneous or evoked 5-HT release from the mucosa is necessary for the activation of Dogiel Type II neurons that generate CMMCs.


Figures

Figure 1
Figure 1. Correlating calcium activity in identified neurons
A, colonic preparation used for stimulating the mucosa at the oral and anal cut ends. The colonic wall was opened and pinned in the middle with the longitudinal muscle (LM) uppermost. Strips of LM were peeled away to reveal the myenteric plexus. The colon was also opened at the oral and anal ends and pinned with the mucosa uppermost to allow stimulation of the mucosa with a brush (see symbol). The stimulus was registered by activating a light emitting diode (LED), which was located under the organ bath, at the beginning of the stimulus regime. Recordings were made in the middle of the preparation ∼2.5 cm from the sites of stimulation. B, to locally activate the mucosa, nitrogen was spritzed onto the mucosa via a polyethylene tube with a small hole under the recording site. C, to brush the mucosa directly over the imaging site, the preparation was pinned with the mucosa uppermost over a coverslip and imaged using an inverted microscope. D, following calcium imaging experiments the preparation was stained with an antibody to nitric oxide synthase (NOS) and the ganglia on which imaging was performed located (NOS +ve neurons, closed arrows; NOS −ve neurons, open arrows). The square in the circle locates the ganglion that was imaged in E. E, maximum Ca2+ induced fluorescence in myenteric neurons within the ganglion, and later NOS staining of the same ganglion. F, the calcium fluorescence in an individual neuron was converted into a spatio-temporal map (ST map; lower panel). Note that the ST map corresponds to the activity (see line trace) in the neuron. The width of the ST map corresponds to the length of the long axis of the neuron.
Figure 2
Figure 2. Spontaneous and evoked muscle responses during CMMCs
A, Ca2+ activity in the circular muscle (CM) during a spontaneous CMMC. The line trace corresponds to activity in ST map. Horizontal lines below transients trace the occurrence of fast Ca2+ transients in the muscle during the CMMC. B, Ca2+ activity in both the longitudinal muscle (LM) and the CM following an evoked CMMC initiated by stimulating the mucosa at the anal end of the preparation. C, Ca2+ activity in the CM following an evoked CMMC initiated by stimulating the mucosa at the oral end of the preparation. Δy shows the displacement (contraction) of the tissue. D, Ca2+ activity in the CM after stimulating the mucosa with a puff of nitrogen directly under the recording site. Note that a second stimulus generates an aborted response.
Figure 3
Figure 3. Comparison of neuronal responses during an evoked and a spontaneous CMMC
A, average Ca2+ and silhouette showing neurons in a ganglion from which Ca2+ responses were measured. B, low power imaging (×20 objective) of Ca2+ activity in 10 neurons located in a single myenteric ganglion during an evoked and spontaneous CMMC, as indicated by increased activity in the CM and the associated contraction. Note that during both the spontaneous and evoked CMMC several neurons (1 to 3) decreased their activity, whereas other neurons increased in activity during the CMMC. Height of ST maps indicate long axis of neurons.
Figure 4
Figure 4. Calcium responses in myenteric neurons between and during an evoked CMMC
A, low power imaging (×20 objective) of Ca2+ activity in 38 myenteric neurons located in 4 ganglia (labelled G1-G4 on figure). Left hand panel (LHP) shows average Ca2+, whereas right hand panel (RHP) shows the location and the size of neurons. B, LHP shows the spontaneous activity in these neurons between CMMCs. The heights of the ST maps indicate the length of the long axis of the neurons. Lower ST map and line traces indicate Ca2+ activity in CM, and Δy shows the displacement (contraction) of the tissue at the bottom of each panel. Middle panel and right hand panel show the Ca2+ responses of these same neurons to anal and oral stimulation of the mucosa respectively. Note that both oral and anal stimulation evoked a similar CMMC response in the CM. Dotted horizontal lines indicate neurons in different ganglia and activity in the circular muscle. Vertical lines indicate the duration of muscle activity during the CMMC.
Figure 5
Figure 5. Latency and duration of activity in myenteric neurons at the onset of CMMCs
A, the latency of onset of excited neurons following an anal mucosal stimulus (61 neurons; n= 4). B, the duration of Ca2+ transients in neurons (♦) and muscle (○) following evoked CMMCs (n= 6). C, the activation of excited neurons (upper bars) and inhibited neurons (lower bars) relative to the first rapid Ca2+ transient in the muscle (0 s) following an evoked CMMC (85 neurons, n= 6). Note that a number of neurons fired before the onset of the muscle, and that the neurons that ceased firing often occurred later during the CMMC.
Figure 6
Figure 6. Effects of blocking neurotransmission on anally evoked responses
A, Ca2+ responses in 9 neurons to anal mucosal stimulation. Note that during the CMMC the prolonged excitatory responses (neurons 1, 2, 3, 5, and 6) were somewhat variable in both duration and onset, as were the inhibitory responses (neurons 4, 7, 8, 9). However, following hexamethonium (100 μm) the responses in all neurons to stimulation were blocked, although their prestimulus activity continued. B, anal stimulation of the mucosa evoked responses in several myenteric neurons after nicardipine (1 μm), which abolished responses in the muscle. Note: dotted lines indicate where CMMC is likely to be occurring. Following the further addition of TTX (1 μm) all spontaneous and evoked Ca2+ transients in these neurons were abolished.
Figure 7
Figure 7. Ca2+ activity in NOS +ve neurons
A, between CMMCs, the activity in NOS +ve neurons occurred in regular bursts (neurons 1–4; see left hand panel). Following anal mucosal stimulation there was a brief increase in burst activity in most of these neurons (see neurons 1, 2 and 4; right hand panel), except neuron 3 just before the onset of the CMMC. During the CMMC all these neurons decreased their activity. BE, responses of NOS +ve neurons to anal mucosal stimulation in another preparation. B, left hand panel shows the location of NOS +ve neurons (arrows) in two ganglia. Right hand panel shows the average Ca2+ activity of neurons within these ganglia. C, NOS +ve neurons (1–5) decreased their activity during the CMMC following anal mucosal stimulation, whereas others (neurons 6–8) appeared to be unchanged by the stimulus. These neurons had complex morphology, round or oval cell bodies with lamina dendrites (see their corresponding morphologies in D). Surprisingly, some NOS +ve neurons increased their firing during the CMMC. These neurons had a simple morphology exhibiting a ‘dew drop’ appearance (see corresponding morphologies in D and E).
Figure 8
Figure 8. Ca2+ transients in and characteristics of Dogiel Type II neurons
High power imaging (×40 and 60 objective) of Ca2+ activity in Dogiel Type II neurons. A, local stimulation (puffs of nitrogen applied to the mucosa) evoked a brief Ca2+ transient in two neurons (N1 and N2) that appeared to have Dogiel Type II morphology. These responses were mimicked in the processes (S1, S2 and S3) that ramified throughout the ganglia and appeared to emanate from these neurons. B, most mitotracker +ve neurons (left hand panel) appeared to also contain calbindin (right hand panel). Neurons were considered positive for either mitotracker or calbindin if they had an average pixel intensity greater than 150 (8-bit scale). Mitotracker +ve and calbindin +ve neurons had a similar area and shape and were longer and wider than neurons that were considered to be negative for these labels. White arrows indicate mitotracker stained neurons and calbindin +ve neurons; open arrows indicate mitotracker stained neurons but calbindin −ve neurons. C, analysis of the average intensities of calbindin +ve versus mitotracker +ve labelled neurons reveals that positive neurons are readily identifiable, and, given the two labels, are statistically more likely to be either co-labelled or negative for both substances. Dotted line respresents the threshold for a labelled neuron. D, analysis of the size of calbindin +ve, mitotracker +ve, and −/− neurons demonstrates that neurons that label positive for either or both substances have significantly larger average soma areas (558 μm2, to 462 μm2, to 165 μm2, respectively), height (35 μm, to 30 μm, to 16 μm, respectively), and width (24 μm, to 22 μm, to 13 μm, respectively).
Figure 9
Figure 9. Responses of mitotracker +ve neurons to local stimulation
High power imaging (×60) was used to record responses in neurons to local stimulation. A, upper panel shows average calcium in neurons and location of selected neurons. Lower panel shows location of neurons stained with mitotracker (filled arrows) in the same ganglia. Following local mucosal stimulation (a puff of nitrogen administered to the mucosa under the recording site) two of the 4 mitotracker +ve neurons (left hand panel; e.g. neurons 1 and 2) responded to local stimulation with a brief Ca2+ transient; whereas, two other mitotracker +ve neurons did not respond (see left hand panel, neurons 3 and 4). However, 3 of these 4 neurons (1–3) exhibited a sustained response following anal and oral mucosal stimulation. B, upper panel: shows average calcium in neurons before stimulation, and location of selected neurons; middle panel shows average calcium immediately following stimulation, and lower panel shows location of neurons stained with mitotracker (filled arrows). A single brush stroke applied to the mucosa over the recording site evoked Ca2+ transients in both mitotracker +ve neurons (1–4) and in mitotracker −ve neurons (5–8), although neuron 5 failed to respond. Ondansetron (3 μm) significantly reduced the responses in these neurons (1–8) to mucosal stimulation (3 strokes). Apparent changes in activity in CM and displacement are stimulus artifacts. C, left hand panel: average calcium in ganglia and location of selected neurons; right hand panel: location of mitotracker +ve (filled arrows) and mitotracker −ve (open arrows) neurons. In the presence of hexamethonium (100 μm), brushing the mucosa (5 strokes) over the stimulation site evoked a sustained Ca2+ response in both mitotracker +ve neurons (1–3) and in mitotracker −ve neurons (4 and 5). Ondansetron (3 μm) significantly reduced the responses to stroking the mucosa in these neurons, leaving mostly the stimulus artifact. In these experiments, probenecid (0.5 mm; anion transport pump inhibitor) was added to the Krebs solution bathing the tissue.
Figure 10
Figure 10. Neural activity in preparations without the mucosa
A, both NOS +ve neurons and NOS −ve neurons usually exhibited ongoing bursts of activity, even though the CM was quiescent. Note that the fifth NOS +ve neuron went from burst activity to more continuous firing pattern B, following the sequential addition of blockers of fast synaptic transmission, hexamethonium (Hex, 100 μm), ondansetron (Ondan, 1 μm) and pyridoxal-phosphate-6-azo(benzene-2,4-disulfonic acid) tetrasodium salt (PPADs, 10 μm), there was a decrease in the number of both NOS +ve and NOS −ve neurons within the field of view that exhibited spontaneous Ca2+ transients. C, following the addition of these drugs the frequency of firing also decreased, which was more pronounced in NOS +ve neurons. Data from 73 neurons, 29 NOS +ve, 44 NOS −ve; n= 5; **P < 0.01. D, upper panel, average Ca2+ intensity and location of mitotracker +ve neurons (1–3, filled arrows) and mitotracker −ve neurons (4–7, open arrows). Lower panel, mitotracker staining of same ganglion. Note that neurons 1–3 are mitotracker +ve (filled arrows) and 4–7 are negative. Spontaneous activity in a preparation without the mucosa. Vertical dotted line shows synchronized activity in the 3 mitotracker +ve neurons that appears to correlate with an increase in activity in neurons 4 and 7, and the onset of a reduction in Ca2+ in neurons 5 and 7.

Similar articles

Cited by

References

    1. Bertrand PP, Kunze WA, Furness JB, Bornstein JC. The terminals of myenteric intrinsic primary afferent neurons of the guinea-pig ileum are excited by 5-hydroxytryptamine acting at 5-hydroxytryptamine-3 receptors. Neuroscience. 2000;101:459–469. - PubMed
    1. Brierley SM, Nichols K, Grasby DJ, Waterman SA. Neural mechanisms underlying migrating motor complex formation in mouse isolated colon. Br J Pharmacol. 2001;132:507–517. - PMC - PubMed
    1. Bywater RA, Small RC, Taylor GS. Neurogenic slow depolarisations and rapid oscillations in circular muscle of mouse colon. J Physiol. 1989;413:505–519. - PMC - PubMed
    1. Bush TG, Spencer NJ, Watters N, Sanders KM, Smith TK. Spontaneous migrating motor complexes occur in both the terminal ileum and colon of the C57BL/6 mouse in vitro. Auton Neurosci. 2000;84:162–168. - PubMed
    1. Christensen J, Anuras S, Arthur C. Influence of intrinsic nerves on electromyogram of cat colon in vitro. Am J Physiol Endocrinol Metab. 1978;234:E641–647. - PubMed

Publication types