. 2010 Feb 1;588(Pt 3):479-93.
doi: 10.1113/jphysiol.2009.179200. Epub 2009 Nov 30.

Temperature jump induced force generation in rabbit muscle fibres gets faster with shortening and shows a biphasic dependence on velocity

Affiliations

Temperature jump induced force generation in rabbit muscle fibres gets faster with shortening and shows a biphasic dependence on velocity

K W Ranatunga et al. J Physiol. .

Abstract

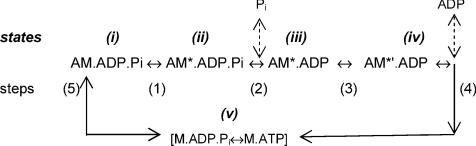
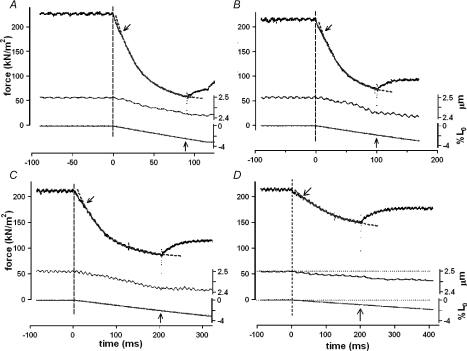
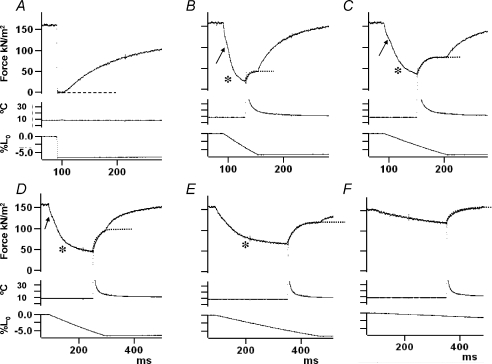
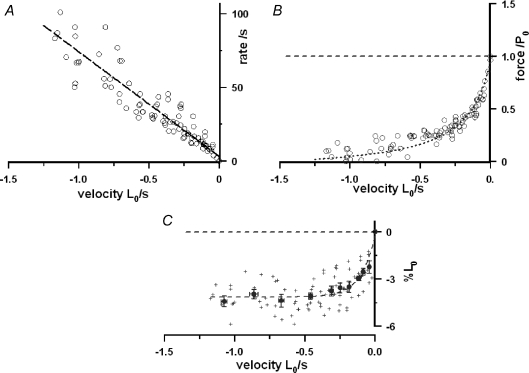
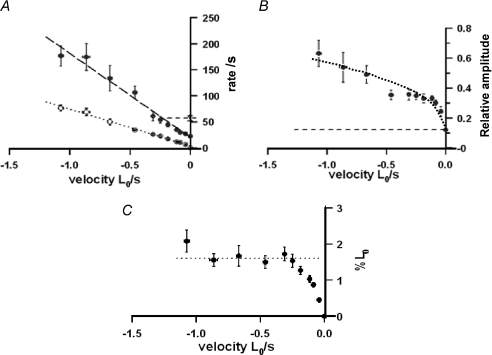
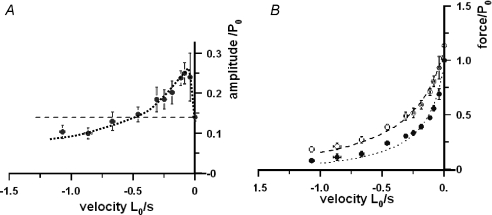
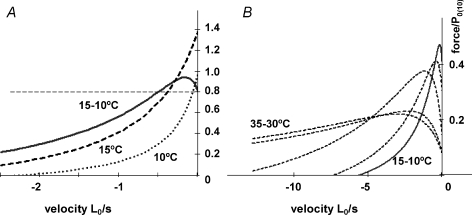
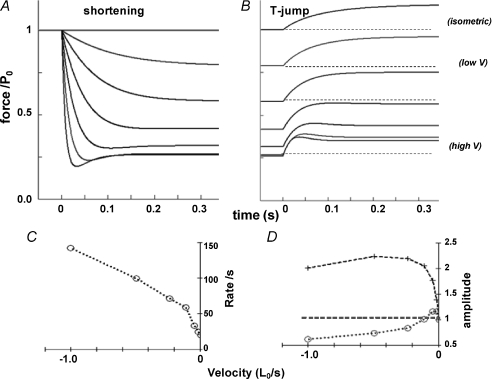
We examined the tension responses to ramp shortening and rapid temperature jump (<0.2 ms, 3-4 degrees C T-jump) in maximally Ca(2+)-activated rabbit psoas muscle fibres at 8-9 degrees C (the fibre length (L(0)) was approximately 1.5 mm and sarcomere length 2.5 microm). The aim was to investigate the strain sensitivity of crossbridge force generation in muscle. The T-jump induced tension rise was examined during steady shortening over a wide range of velocities (V) approaching the V(max) (V range approximately 0.01 to approximately 1.5 L(0) s(1)). In the isometric state, a T-jump induced a biphasic tension rise consisting of a fast (approximately 50 s(1), phase 2b) and a slow (approximately 10 s(1), phase 3) component, but if treated as monophasic the rate was approximately 20 s(1). During steady shortening the T-jump tension rise was monophasic; the rate of tension rise increased linearly with shortening velocity, and near V(max) it was approximately 200 s(1), approximately 10x faster than in the isometric state. Relative to the tension reached after the T-jump, the amplitude increased with shortening velocity, and near V(max) it was 4x larger than in the isometric state. Thus, the temperature sensitivity of muscle force is markedly increased with velocity during steady shortening, as found in steady state experiments. The rate of tension decline during ramp shortening also increased markedly with increase of velocity. The absolute amplitude of T-jump tension rise was larger than that in the isometric state at the low velocities (<0.5 L(0) s(1)) but decreased to below that of the isometric state at the higher velocities. Such a biphasic velocity dependence of the absolute amplitude of T-jump tension rise implies interplay between, at least, two processes that have opposing effects on the tension output as the shortening velocity is increased, probably enhancement of crossbridge force generation and faster (post-stroke) crossbridge detachment by negative strain. Overall, our results show that T-jump force generation is strain sensitive and becomes considerably faster when exposed to negative strain. Thus the crossbridge force generation step in muscle is both temperature sensitive (endothermic) and strain sensitive.


Figures

Scheme 1
Scheme 1
Figure 2
Figure 2. Sample records of tension and sarcomere length change in an experiment
Each frame shows records of tension (upper trace) and displacement of the first order He–Ne fibre diffraction (sarcomere length change – middle trace) during a ramp shortening (bottom trace) from a fibre preparation (at ∼9°C). The ramp shortening begins at time zero (the vertical dashed line); the shortening velocities decreased from ∼0.3 L0 s−1 in A to ∼0.04 L0 s−1 in D and the display time scales are different. The slanting arrow above a tension trace denotes the P1 transition (see Fig. 1) and application of a ∼3°C T-jump is shown by a vertical arrow displayed above the abscissa. The dotted curve extended through the tension trace is a single exponential fitted to tension data points between the P1 transition and the T-jump. Note that despite the noisy recording, the sarcomere length remains steady during the isometric phase (before the vertical dashed line) but decreases approximately in parallel to the fibre shortening. The tension decline during shortening (fitted curve) is faster at higher shortening velocities.
Figure 1
Figure 1. Tension responses to ramp shortening and to T-jump during shortening
The fibre was maximally Ca-activated at ∼8°C and during the isometric tension plateau (top trace), a ramp shortening of ∼7%L0 was applied (bottom trace); middle trace is the temperature of the trough solution monitored close to the fibre. A, a rapid ramp shortening (>3 L0 s−1), with no T-jump, leads to unloaded shortening, fall in tension and subsequent tension re-development; the dashed line denotes zero tension. B–F, tension responses to ramp shortening at five different velocities, decreasing from B (∼1 L0 s−1) to F (0.04 L0 s−1). Note that frames D, E and F are displayed on a slower time scale. An asterisk denotes the gradual decrease of tension slope (the P2 transition) towards a shortening steady tension. As first described in frog fibres by Ford et al. (1977), an initial inflection (arrow, referred to as the P1 transition) is seen in a tension decline during ramp shortening and its amplitude is larger at the higher velocities (see Roots et al. 2007, in rat fibres). In each case, a T-jump of ∼3°C was induced by a laser pulse during the subsequent steady shortening after the P2 transition; the middle trace is the thermocouple output where the initial overshoot and slow decay are due to direct laser light absorption by the thermocouple (see Goldman et al. 1987; Ranatunga, 1996). Note that, as the velocity is increased from F to B, the tension rise after T-jump (see the superimposed dotted line) becomes faster and its amplitude increases and then decreases.
Figure 3
Figure 3. Force decline during ramp shortening and the force–shortening velocity relation
Pooled data from nine fibres in each of which tension responses were examined at 8–9°C during ramp shortening at a series of velocities. Shortening velocity (L0 s−1) is plotted on a negative abscissa. A, rate of force decline. The reciprocal time constant (1/τ1) of the exponential curve fitted to the post-P1 tension decline prior to the T-jump (see Fig. 2) is plotted as a rate on the ordinate. The rate is correlated with velocity (r > 0.9, n= 106) and increases approximately linearly with velocity. The line fitted with no constraint to pass through the origin (as shown), gives a slope (±s.e.m.) of 71.1 (±2.78)/L0 and a significant intercept of 3.16 (±1.4) s−1. With the intercept fixed at zero, the slope is 75.8 (±1.86)/L0. B, the force–shortening velocity relation. The approximate steady force reached (after the P2 transition) during ramp shortening at different velocities (V), obtained by direct measurement or, in some cases, from extrapolation of the pre-T-jump tension trace. Force is plotted as a ratio of isometric force, P0, and the dotted curve is A. V. Hill's hyperbolic relation (Hill, 1938), fitted as P=a(VmaxV)/(V+b), where a and b are constants, a/P0 is ∼0.1 and Vmax is ∼1.5 L0 s−1. Despite scatter, the data distribution is basically similar to our previous findings (see Ranatunga et al. 2007). C, the extent of shortening. The extent of shortening from the beginning of the ramp to ∼95% tension decline towards the steady state (i.e. approximate completion of the P2 transition) was calculated as velocity × 3τ1 and is plotted as %L0. Crosses are individual data points (n= 106) and filled symbols means (±s.e.m., n= 5–18) from pooled data. The required extent of shortening increases with velocity and reaches a steady level of ∼4%L0 at velocities higher than 0.5 L0 s−1.
Figure 4
Figure 4. Characteristics of T-jump induced tension rise during steady shortening
Pooled data from nine fibres in each of which tension responses to a 3–4°C T-jump were examined over a range of shortening velocities at 8–9°C, as in Fig. 1. A single exponential curve was fitted to the post-T-jump tension rise to extract the rate of tension rise (1/τ2 (time constant)) and the amplitude. The mean (±s.e.m., n= 5–18) data are plotted against shortening velocity as in Fig. 3. A, rate of tension rise. Filled symbols show the rate of T-jump induced tension rise, where the dashed line is the fitted linear regression to the pool of original data (excluding values for isometric; r > 0.7, n= 95). The rate increases approximately linearly with increase of shortening velocity, reaching >200 s−1 at ∼Vmax. Assuming monophasic tension rise, the isometric value is 22 (±2.5) s−1 (filled symbol on the ordinate); phase 2b from biphasic analysis was ∼55 s−1 (× on the ordinate and short-dashed horizontal line). For comparison, the open symbols show the data for the rate of tension decline during ramp shortening as in Fig. 3, but plotted as means (±s.e.m.). B, normalised amplitude of tension rise. The amplitude is plotted as a ratio of the post T-jump tension during steady shortening; the horizontal dashed line denotes the isometric value and the dotted curve through the points is fitted by eye. With increase of shortening velocity, the amplitude increases steeply at low velocities (as in our previous study) and then increases more slowly but remains above the isometric value at higher velocities. C, extent of shortening during tension rise. The extent of shortening was calculated using velocity (L0 s−1) and time constant (τ2) from curve fit to tension rise, as (velocity × 3τ2). It is an approximate estimate of ∼95% of the T-jump tension rise. The extent of shortening increases with velocity and remains at ∼1.6%L0 (dotted line, fitted by eye) at velocities > −0.25 L0 s−1.
Figure 5
Figure 5. Absolute amplitude of tension rise and the force-shortening velocity curves
A, amplitude of T-jump tension rise. The data in Fig. 4B are re-plotted. To pool data from different fibres, the T-jump induced tension amplitude was normalised to isometric force (P0 at the pre-T-jump temperature of ∼8–9°C) and the dotted curve through the data is fitted by eye. The data show that the absolute amplitude of tension rise for a standard T-jump is higher than isometric (horizontal dashed line) at low velocities (as reported in the previous study), but decreases below isometric at higher velocities (> ∼0.5 L0 s−1). Thus, the temperature sensitivity of force in steady shortening muscle suggests a biphasic force–shortening velocity relation. B, the force–shortening velocity curves. Pooled force data (means ±s.e.m.) at different velocities for post-T-jump (∼12°C – open circles) and pre-T-jump (8–9°C – filled circles) temperatures; force is normalised to the (pre-T-jump) isometric force (P0). A force–velocity curve is fitted separately to each pool (n= 106, as in Fig. 3B). The curve for 8–9°C data (dotted curve) is the same as in Fig. 3B and the curve for ∼12°C data (dashed curve) gives a Vmax of ∼2.5 and a/P0 of ∼0.14.
Figure 6
Figure 6. Force–shortening velocity curves at different temperatures from steady state experiments
A, the steady-state force versus shortening velocity curves for intact rat fast (extensor digitorum longus) muscle at 10°C (dotted curve) and 15°C (dashed curve). The curves were constructed using the mean Vmax and a/P0 data given in Table 1 of Ranatunga (1984) in which the isotonic release method was used to determine the force–shortening velocity relations. For comparison with Fig. 5A and B, force is normalised to P0 at 10°C (on the basis of the temperature dependence of the tetanic force of rat fast muscle (Coupland & Ranatunga, 2003). The continuous curve is the tension difference between 15°C and 10°C; for clarity in presentation, 2 × tension difference is plotted, where the horizontal dashed line is the isometric force difference The data from steady state experiments show the basic features of the T-jump amplitude data in Fig. 5A and B, particularly, that the force increment for a standard 5°C increase of temperature is larger than in the isometric state at low velocities (<0.5 L0 s−1), but decreases below that of isometric at higher velocities. B, 5°C difference force versus shortening velocity curves for a range of temperatures from the same study. Note that the biphasic temperature sensitivity of force in shortening muscle is evident at all temperatures, although the curves are shifted to higher velocities at the higher temperatures (e.g. 30–35°C). Since force in lengthening muscle was insensitive to T-jump (Ranatunga et al. 2007), the difference–tension curves would remain near zero on the positive side of the abscissa.
Figure 7
Figure 7. Simulations using a five-state kinetic model
Simulations were carried out using the kinetic model in Scheme 1 where the sum of the fractional occupancy of attached states ii, iii and iv was taken as force (see Methods). A, after the isometric steady state was achieved, a shortening was induced at time zero by increasing k+4 and k+1. The force responses to six ramp shortening velocities (the velocity increasing from top to bottom) are shown. At the highest velocity, the sum of all attached states decreased to 0.58 of that in the isometric state. B, after the steady state is reached at a given velocity, and in the isometric state (top), a T-jump of ∼5°C is introduced at time zero, by increasing k+1 (Q10 of ∼4). The traces show the approach to the new steady state of the simulated force and the dashed lines show the pre-T-jump force levels for some traces. Note that the rate of T-jump tension rise is faster at high velocity. The amplitude is largest at the low shortening velocities (second and third traces from top). C, the rate of T-jump tension rise (from direct measurement of the time constant from tension traces) is plotted against k+4, arbitrarily converted to a velocity for illustrating the data (see Methods). D, the absolute amplitude (open circles) shows a biphasic dependence on velocity; it is ∼15% larger than in the isometric state at low velocities but decreases to below the isometric level at the higher velocities. When normalised to the post-T-jump tension level (crosses), the amplitude increases with velocity to ∼2 times the T-jump tension amplitude in isometric state. The above are qualitatively similar to the experimental findings from T-jumps.

Similar articles

Cited by

References

    1. Bagni MA, Cecchi G, Colombini B. Crossbridge properties investigated by fast ramp stretching of activated frog muscle fibres. J Physiol. 2005;565:261–268. - PMC - PubMed
    1. Bershitsky SY, Tsaturyan AK. Tension transients initiated by the Joule temperature jump during steady shortening of skinned muscle fibres. In: Maréchal G, Carraro U, editors. Muscle and Motility. Andover, Hampshire: Intercept; 1990. pp. 277–281.
    1. Bershitsky SY, Tsaturyan AK. Tension responses to Joule temperature jump in skinned rabbit muscle fibres. J Physiol. 1992;447:425–448. - PMC - PubMed
    1. Bershitsky SY, Tsaturyan AK. The elementary force generation process probed by temperature and length perturbations in muscle fibres from the rabbit. J Physiol. 2002;540:971–988. - PMC - PubMed
    1. Colombini B, Nocella M, Benelli G, Cecchi G, Bagni MA. Effect of temperature on cross-bridge properties in intact frog muscle fibres. Am J Physiol Cell Physiol. 2008;294:C1113–C1117. - PubMed

Publication types

LinkOut - more resources