

Atrial natriuretic peptide modulation of albumin clearance and contrast agent permeability in mouse skeletal muscle and skin: role in regulation of plasma volume
- PMID: 19948658
- PMCID: PMC2821727
- DOI: 10.1113/jphysiol.2009.180463
Atrial natriuretic peptide modulation of albumin clearance and contrast agent permeability in mouse skeletal muscle and skin: role in regulation of plasma volume
Abstract
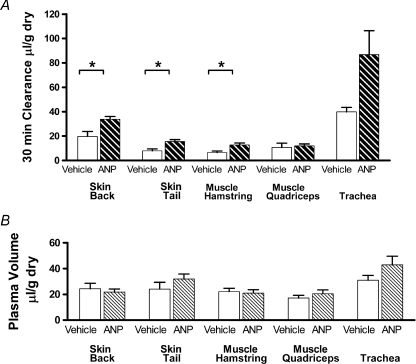
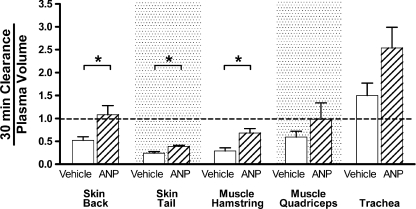
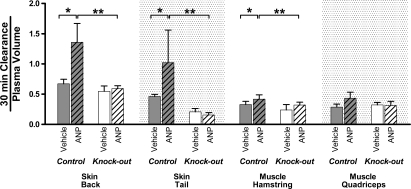
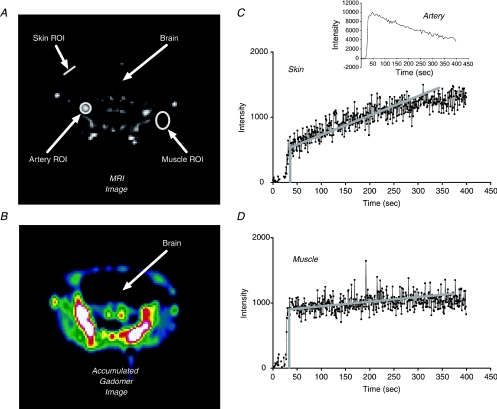
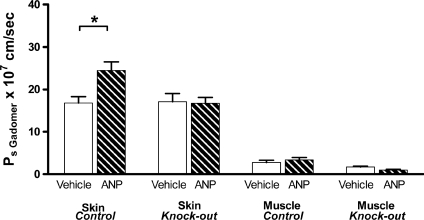
Atrial natriuretic peptide (ANP) via its guanylyl cyclase-A (GC-A) receptor participates in regulation of arterial blood pressure and vascular volume. Previous studies demonstrated that concerted renal diuretic/natriuretic and endothelial permeability effects of ANP cooperate in intravascular volume regulation. We show that the microvascular endothelial contribution to the hypovolaemic action of ANP can be measured by the magnitude of the ANP-induced increase in blood-to-tissue albumin transport, measured as plasma albumin clearance corrected for intravascular volume change, relative to the corresponding increase in ANP-induced renal water excretion. We used a two-tracer method with isotopically labelled albumin to measure clearances in skin and skeletal muscle of: (i) C57BL6 mice; (ii) mice with endothelium-restricted deletion of GC-A (floxed GC-A x tie2-Cre: endothelial cell (EC) GC-A knockout (KO)); and (iii) control littermates (floxed GC-A mice with normal GC-A expression levels). Comparison of albumin clearances in hypervolaemic EC GC-A KO mice with normovolaemic littermates demonstrated that skeletal muscle albumin clearance with ANP treatment accounts for at most 30% of whole body clearance required for ANP to regulate plasma volume. Skin microcirculation responded to ANP similarly. Measurements of permeability to a high molecular mass contrast agent (35 kD Gadomer) by dynamic contrast-enhanced magnetic resonance imaging (DCE-MRI) enabled repeated measures in individual animals and confirmed small increases in muscle and skin microvascular permeability after ANP. These quantitative methods will enable further evaluation of the contribution of ANP-dependent microvascular beds (such as gastro-intestinal tract) to plasma volume regulation.
Figures
Comment in
-
Water, taken in moderation, cannot hurt anybody (Mark Twain 1835-1910).J Physiol. 2010 Jan 15;588(Pt 2):281-2. doi: 10.1113/jphysiol.2009.183715. J Physiol. 2010. PMID: 20080514 Free PMC article. No abstract available.
Similar articles
-
Atrial natriuretic peptide enhances microvascular albumin permeability by the caveolae-mediated transcellular pathway.Cardiovasc Res. 2012 Jan 1;93(1):141-51. doi: 10.1093/cvr/cvr279. Epub 2011 Oct 24. Cardiovasc Res. 2012. PMID: 22025581 Free PMC article.
-
Phosphodiesterase 4 inhibition attenuates atrial natriuretic peptide-induced vascular hyperpermeability and loss of plasma volume.J Physiol. 2011 Jan 15;589(Pt 2):341-53. doi: 10.1113/jphysiol.2010.199588. Epub 2010 Nov 22. J Physiol. 2011. PMID: 21098005 Free PMC article.
-
The heart communicates with the endothelium through the guanylyl cyclase-A receptor: acute handling of intravascular volume in response to volume expansion.Endocrinology. 2008 Aug;149(8):4193-9. doi: 10.1210/en.2008-0212. Epub 2008 May 1. Endocrinology. 2008. PMID: 18450968 Free PMC article.
-
Endothelial actions of atrial and B-type natriuretic peptides.Br J Pharmacol. 2012 May;166(2):522-31. doi: 10.1111/j.1476-5381.2012.01827.x. Br J Pharmacol. 2012. PMID: 22220582 Free PMC article. Review.
-
Cardiac and intestinal natriuretic peptides: insights from genetically modified mice.Peptides. 2005 Jun;26(6):1078-85. doi: 10.1016/j.peptides.2004.08.031. Epub 2005 Apr 14. Peptides. 2005. PMID: 15911075 Review.
Cited by
-
Permeability and contractile responses of collecting lymphatic vessels elicited by atrial and brain natriuretic peptides.J Physiol. 2013 Oct 15;591(20):5071-81. doi: 10.1113/jphysiol.2013.260042. Epub 2013 Jul 29. J Physiol. 2013. PMID: 23897233 Free PMC article.
-
Longitudinal investigation of permeability and distribution of macromolecules in mouse malignant transformation using PET.Clin Cancer Res. 2011 Feb 1;17(3):550-9. doi: 10.1158/1078-0432.CCR-10-2049. Epub 2010 Nov 24. Clin Cancer Res. 2011. PMID: 21106723 Free PMC article.
-
Tonic regulation of vascular permeability.Acta Physiol (Oxf). 2013 Apr;207(4):628-49. doi: 10.1111/apha.12076. Epub 2013 Feb 25. Acta Physiol (Oxf). 2013. PMID: 23374222 Free PMC article. Review.
-
Ultrasound increases nanoparticle delivery by reducing intratumoral pressure and increasing transport in epithelial and epithelial-mesenchymal transition tumors.Cancer Res. 2012 Mar 15;72(6):1485-93. doi: 10.1158/0008-5472.CAN-11-3232. Epub 2012 Jan 26. Cancer Res. 2012. PMID: 22282664 Free PMC article.
-
The role of atrial natriuretic peptide to attenuate inflammation in a mouse skin wound and individually perfused rat mesenteric microvessels.Physiol Rep. 2016 Sep;4(18):e12968. doi: 10.14814/phy2.12968. Physiol Rep. 2016. PMID: 27670406 Free PMC article.
References
-
- Adamson RH, Huxley VH, Curry FE. Single capillary permeability to proteins having similar size but different charge. Am J Physiol Heart Circ Physiol. 1988;254:H304–H312. - PubMed
-
- Almeida FA, Suzuki M, Maack T. Atrial natriuretic factor increases hematocrit and decreases plasma volume in nephrectomized rats. Life Sci. 1986;39:1193–1199. - PubMed
-
- Brekke C, Lundervold A, Enger PO, Brekken C, Stalsett E, Pedersen TB, Haraldseth O, Kruger PG, Bjerkvig R, Chekenya M. NG2 expression regulates vascular morphology and function in human brain tumours. Neuroimage. 2006;29:965–976. - PubMed
-
- Curry FE. Mechanics and thermodynamics of transcapillary exchange. In: Renkin EM, Michel CC, editors. Handbook of Physiology, section 2, The Cardiovascular System, vol IV, Microcirculation. Bethesda, MD: American Physiological Society; 1984. pp. 375–409.
Publication types
MeSH terms
Substances
Grants and funding
LinkOut - more resources
Full Text Sources
Molecular Biology Databases
Research Materials
Miscellaneous