. 2010 Jan 29;285(5):3310-8.
doi: 10.1074/jbc.M109.060418. Epub 2009 Nov 30.

Aminopeptidase fingerprints, an integrated approach for identification of good substrates and optimal inhibitors

Affiliations

Aminopeptidase fingerprints, an integrated approach for identification of good substrates and optimal inhibitors

Marcin Drag et al. J Biol Chem. .

Abstract

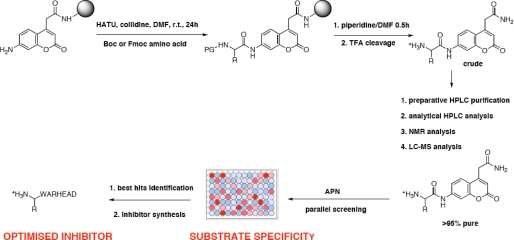
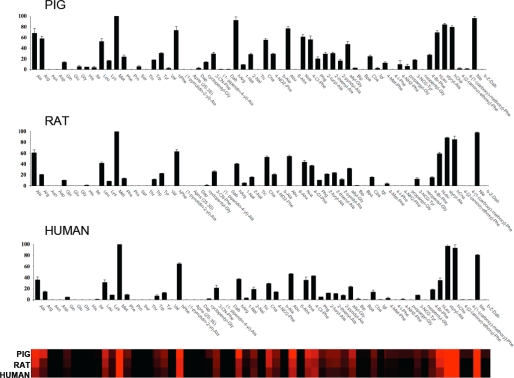
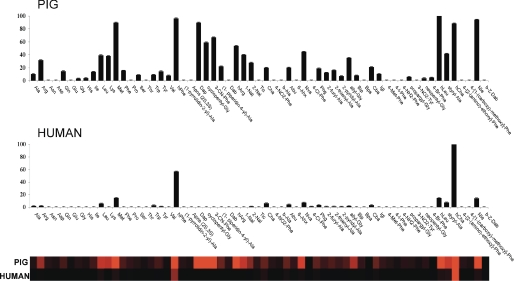
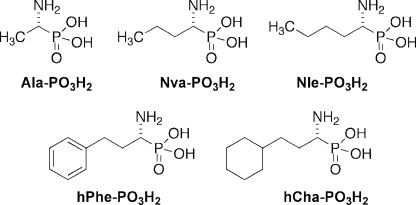
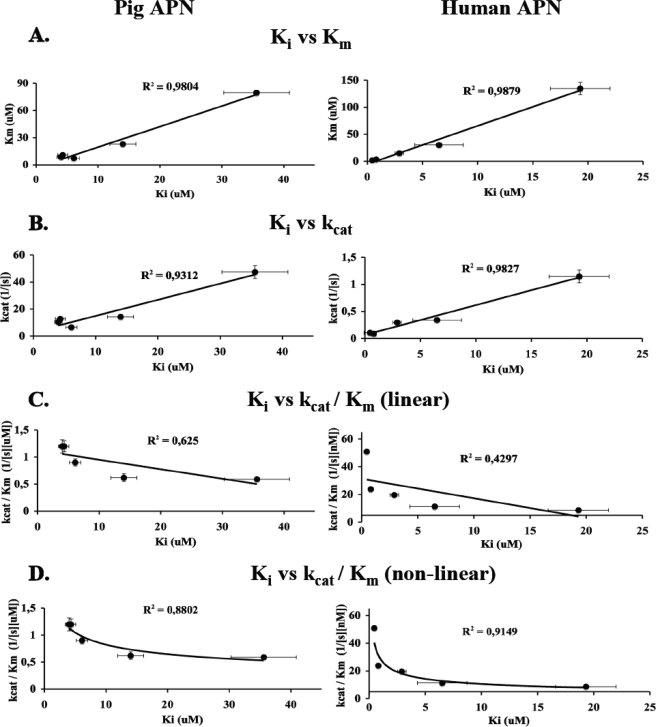
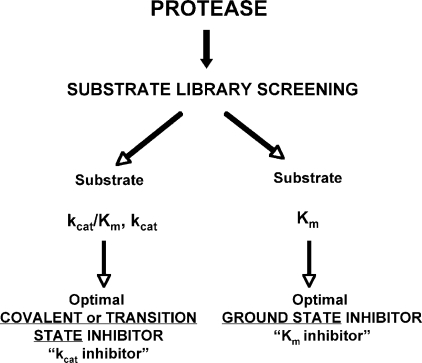
Aminopeptidases process the N-terminal amino acids of target substrates by sequential cleavage of one residue at a time. They are found in all cell compartments of prokaryotes and eukaryotes, being implicated in the major proteolytic events of cell survival, defense, growth, and development. We present a new approach for the fast and reliable evaluation of the substrate specificity of individual aminopeptidases. Using solid phase chemistry with the 7-amino-4-carbamoylmethylcoumarin fluorophore, we have synthesized a library of 61 individual natural and unnatural amino acids substrates, chosen to cover a broad spectrum of the possible interactions in the S1 pocket of this type of protease. As proof of concept, we determined the substrate specificity of human, pig, and rat orthologs of aminopeptidase N (CD13), a highly conserved cell surface protease that inactivates enkephalins and other bioactive peptides. Our data reveal a large and hydrophobic character for the S1 pocket of aminopeptidase N that is conserved with aminopeptidase Ns. Our approach, which can be applied in principle to all aminopeptidases, yields useful information for the design of specific inhibitors, and more importantly, reveals a relationship between the kinetics of substrate hydrolysis and the kinetics of enzyme inhibition.


Figures

FIGURE 1.
FIGURE 1.
Schematic representation of the synthesis and application of the fluorogenic substrate library for aminopeptidases. The library contains 61 natural and unnatural amino acids. HATU, 2-(7-aza-benzotriazole-1-yl)-1,1,3,3-tetramethyluronium hexafluorophosphate; Boc, t-butoxycarbonyl; r.t., room temperature; TFA, trifluoroacetate.
FIGURE 2.
FIGURE 2.
Individual substrate velocities of human, pig, and rat aminopeptidases. Enzyme concentrations were in the range 0.2–5 nm, and the final concentration of the substrate in each well was 1 μm. ACC production was monitored using an fMax multiwell fluorescence plate reader (Molecular Devices) at an excitation wavelength of 355 nm and an emission wavelength of 460 nm. Assay time was 15–30 min. The x axis represents the abbreviated amino acid names (for full names and structures, see supplemental material). hArg, homoarginine; Abu, 2-aminobutyric acid; Nva, norvaline; hLeu, homoleucine; hCha, 4-cyclohexyl-l-butyric acid; Dap, l-2,3-diaminopropionic acid; 3-CN-Phe, 3-cyano-l-phenylalanine; Dab, l-2,4-diaminobutyric acid; hArg, homoarginine; 1-Nal, 3-(1-naphthyl)-l-alanine; 2-Nal, 3-(2-naphthyl)-l-alanine; Tic, (3l)-1,2,3,4-tetrahydroisoquinoline-3-carboxylic acid; 4-NO2-Phe, 4-nitro-l-phenylalanine; 6-Ahx, 6-aminohexanoic acid; 4-Cl-Phe, 4-chloro-l-phenylalanine; Phg, l-phenylglycine; Bip, l-biphenylalanine; Bpa, 4-benzoyl-l-phenylalanine; Cba, l-2-amino-4-cyanobutyric acid; Igl, l-2-indanylglycine; 4-I-Phe, 4-iodo-l-phenylalanine; 4-NH2-Phe, 4-amino-l-phenylalanine; 3-NO2-Tyr, 3-nitro-l-tyrosine; 4-Br-Phe, 4-bromo-l-phenylalanine; Nle, norleucine; β-Z-Dab, l-2,4(carbobenzyloxy)-diaminobutyric acid. The y axis represents the average relative activity expressed as a percentage of the best amino acid. In the heat map view, the most preferred positions are displayed in bright red, whereas a complete lack of activity is in black, with intermediate values represented by intermediate shades of red. Error bars represent the S.D.
FIGURE 3.
FIGURE 3.
Individual reciprocal Km values of human, pig and rat aminopeptidases. The enzyme concentration was in the range 0.6–5 nm, and the final concentration of the substrate in each well was in the range 0.25–500 μm. ACC production was monitored using an fMax multiwell fluorescence plate reader (Molecular Devices) at an excitation wavelength of 355 nm and an emission wavelength of 460 nm. The x axis represents the abbreviated amino acid names (for full names and structures, see supplemental material). hArg, homoarginine; Abu, 2-aminobutyric acid; Nva, norvaline; hLeu, homoleucine. The y axis represents the average reciprocal Km expressed as a percentage of the best amino acid. In the heat map view, the most preferred positions are displayed in bright red, whereas a complete lack of activity is in black, with intermediate values represented by intermediate shades of red. Error bars represent the S.D. Please see the legend for Fig. 3 for abbreviations.
FIGURE 4.
FIGURE 4.
Structures of the tested α-aminoalkanephosphonic acids.
FIGURE 5.
FIGURE 5.
Plot of the kinetic parameters for the fluorogenic substrates versus their appropriate inhibitor Ki value (data from Table 1). A, plot of the substrate Km versus corresponding phosphonate inhibitor Ki. B, plot of the substrate kcat versus corresponding phosphonate inhibitor Ki. C, plot (linear approach) of the substrate kcat/Km versus corresponding phosphonate inhibitor Ki. D, non-linear plots of the substrate kcat/Km versus corresponding phosphonate inhibitor Ki. Error bars represent the S.D. of the Ki and kinetic terms of experiments run in triplicate.
FIGURE 6.
FIGURE 6.
kcatversus Km inhibitors, predicting optimal inhibitors based on substrate screens. Inhibitor potency depends on the mechanism of binding, and we recognize two primary categories. Inhibitors that operate through mechanism-based inactivation, or transition-state analogs, can be broadly classified as kcat inhibitors, where inhibitor efficiency parallels the kcat value in the cleavage of equivalent substrates. Relative potency of these inhibitors can be predicted simply by determining the hydrolysis rates of substrates in library screens. On the other hand, inhibitors that bind the ground state do not always follow this relationship, and it is inappropriate to extrapolate substrate cleavage data to inhibitor design. In the later case, the Km value in substrate cleavage predicts the order, and more importantly, the potency, of inhibitor efficiency. As the repertoire of inhibitor types available to medicinal chemists increases, distinguishing between these two mechanisms will become an essential early step in the design of specific protease inhibitors.

Similar articles

Cited by

References

    1. Lowther W. T., Matthews B. W. (2002) Chem. Rev. 102, 4581–4608 - PubMed
    1. Taylor A. (1993) FASEB J. 7, 290–298 - PubMed
    1. Saiki I., Fujii H., Yoneda J., Abe F., Nakajima M., Tsuruo T., Azuma I. (1993) Int. J. Cancer 54, 137–143 - PMC - PubMed
    1. Bradshaw R. A., Yi E. (2002) Essays Biochem. 38, 65–78 - PubMed
    1. Bradshaw R. A., Brickey W. W., Walker K. W. (1998) Trends Biochem. Sci. 23, 263–267 - PubMed

Publication types