

Calculating mixed venous saturation during veno-venous extracorporeal membrane oxygenation
- PMID: 19948749
- PMCID: PMC2943384
- DOI: 10.1177/0267659109354790
Calculating mixed venous saturation during veno-venous extracorporeal membrane oxygenation
Abstract
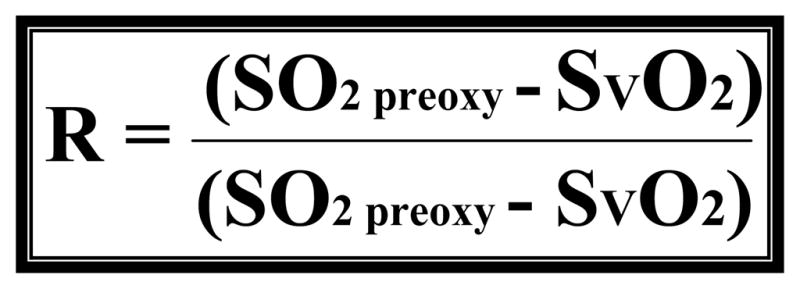
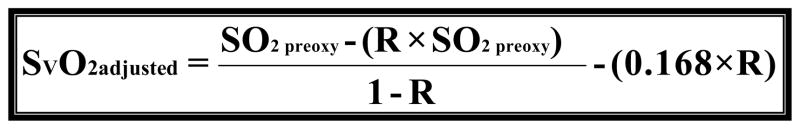
Introduction: Recirculation (R), the shunting of arterial blood back into to the venous lumen, commonly occurs during veno-venous extracorporeal membrane oxygenation (VV-ECMO) and renders the monitoring of the venous line oxygen saturation no longer reflective of patient mixed venous oxygen saturation (S(V)O(2)). Previously, we failed to prove the hypothesis that, once R is known, it is possible to calculate the S(V)O(2) of a patient on VV-ECMO. We hypothesize that we can calculate S(V)O(2) during VV-ECMO if we account for and add an additional correction factor to our model for dissolved oxygen content. Therefore, the purpose of this study is to derive a more accurate model that will allow clinicians to determine S(V)O(2) during VV-ECMO when ultrasound dilution is being used to quantify R.
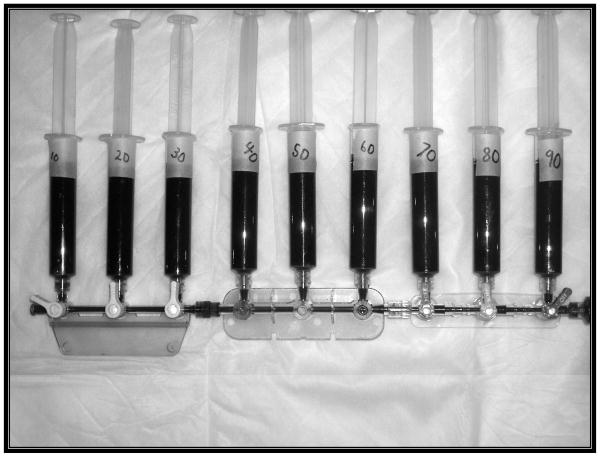
Methods: Using an extracorporeal circuit primed with fresh porcine blood, two stocks of blood were produced; (1) arterial blood (AB), and (2) venous blood (VB). To mimic recirculation, the AB and VB were mixed together in precise ratios using syringes and a stopcock manifold. Six paired stock AB/VB sets were prepared. Two sets were mixed at 20% R increments and 4 sets were mixed at 10% R increments. The partial pressure of oxygen (pO(2) ) and oxygen (O(2)) saturation of the stock blood and resultant mixed blood was determined. The original model was modified by modeling the residual errors with linear regression.
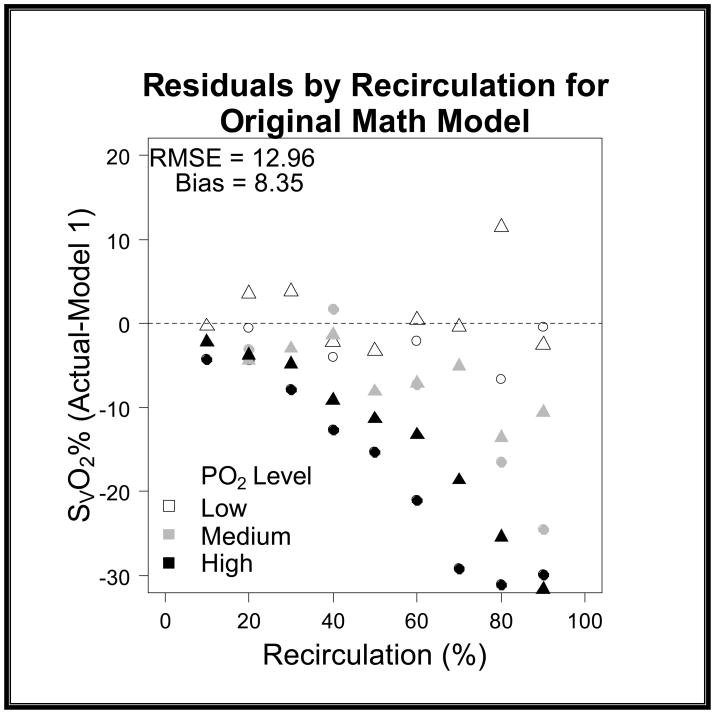
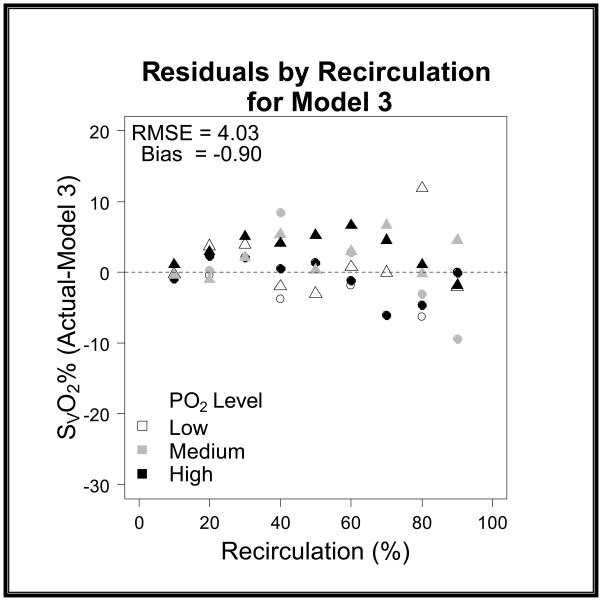
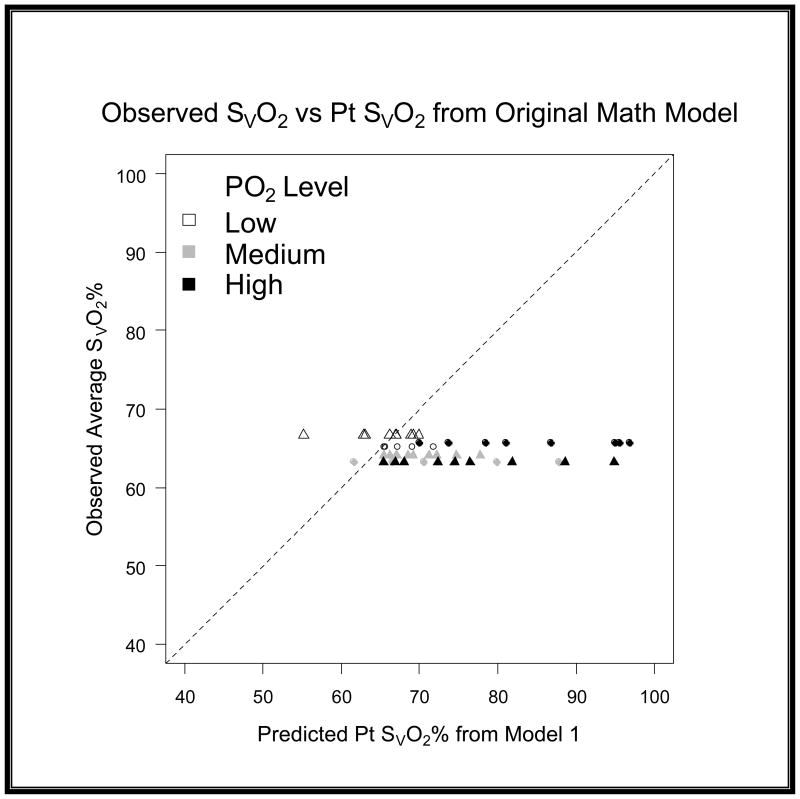
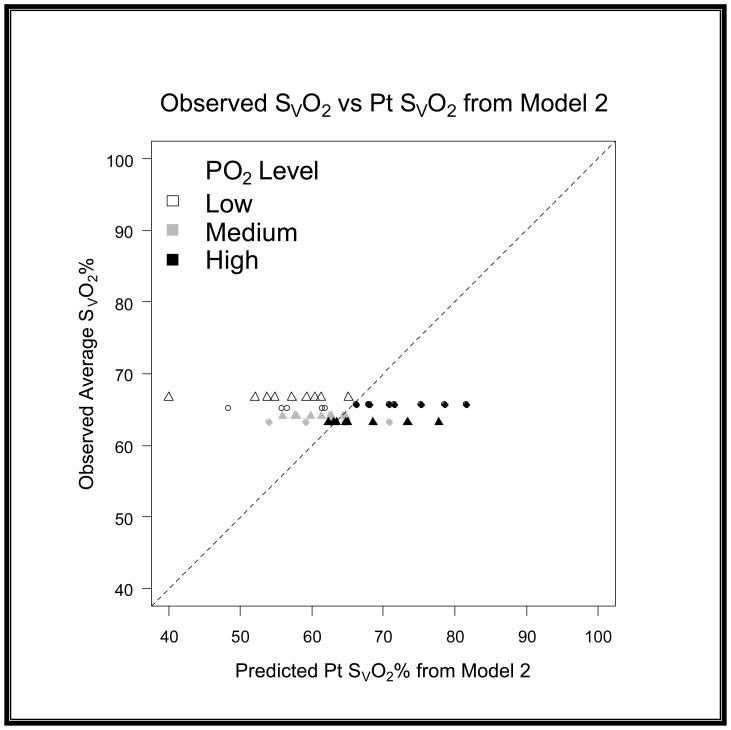
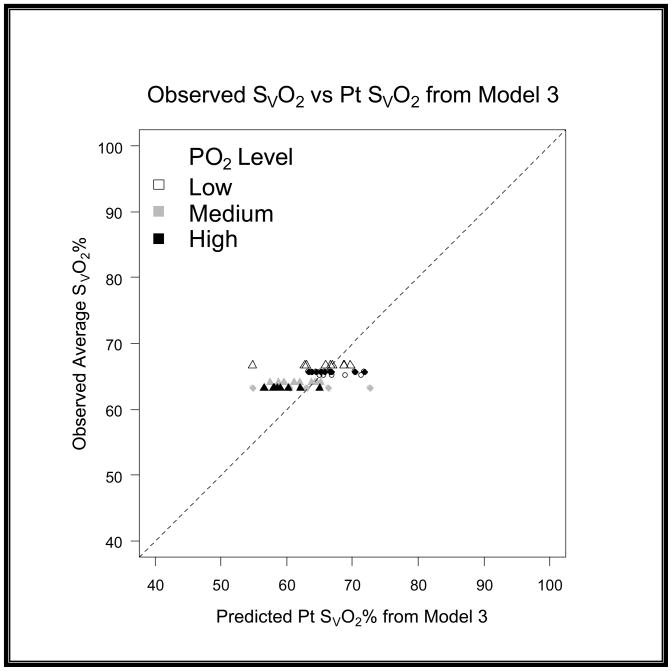
Results: When using the original model, as the partial pressure of arterial oxygen (P(a)O( 2)) of the stock AB increased, the calculated S(V)O(2) was higher than actual, especially at higher R levels. An iteration of the original model incorporating the P(a)O(2) level (low, medium, high) and R was derived to fit the data.
Conclusions: The original model using R and circuit saturations for the calculation of S(V)O( 2) in VV-ECMO patients is an oversimplification that fails to consider the influence of the high pO(2) of arterial blood during therapy. In the future, further improvements in this model will allow clinicians accurately to calculate S(V)O(2) in conjunction with recirculation measurements.
Figures


Comment in
-
Commentary on: Calculating mixed venous saturation during veno-venous ECMO.Perfusion. 2009 Sep;24(5):340. doi: 10.1177/02676591090240050602. Perfusion. 2009. PMID: 20051460 No abstract available.
References
-
- ELSO. ECMO registry report of the Extracorporeal Life Support Organization (ELSO) Ann Arbor, MI: 2008.
-
- Bartlett RH, Roloff DW, Custer JR, et al. Extracorporeal life support, The University of Michigan Experience. JAMA. 2000;283:904–908. - PubMed
-
- Roberts N, Westrope C, Pooboni SK, et al. Venovenous extracorporeal membrane oxygenation for respiratory failure in inotrope dependent neonates. ASAIO J. 2003;49(5):568–571. - PubMed
-
- Hartwig MG, Appel JZ, 3rd, Cantu E, 3rd, et al. Improved results treating lung allograft failure with venovenous extracorporeal membrane oxygenation. Ann Thorac Surg. 2005;80(5):1872–1879. discussion 1879–1880. - PubMed
-
- Delius R, Anderson HL, Schumacher E, et al. Venovenous compares favorably with venoarterial access for extracorporeal membrane oxygenation in neonatal respiratory failure. J Thorac Cardiovasc Surg. 1993;106:329–338. - PubMed
Publication types
MeSH terms
Substances
Grants and funding
LinkOut - more resources
Full Text Sources
Other Literature Sources
