. 2009 Nov;21(11):3641-54.
doi: 10.1105/tpc.109.070417. Epub 2009 Nov 30.

Control of cell proliferation, organ growth, and DNA damage response operate independently of dephosphorylation of the Arabidopsis Cdk1 homolog CDKA;1

Affiliations

Control of cell proliferation, organ growth, and DNA damage response operate independently of dephosphorylation of the Arabidopsis Cdk1 homolog CDKA;1

Nico Dissmeyer et al. Plant Cell. 2009 Nov.

Abstract

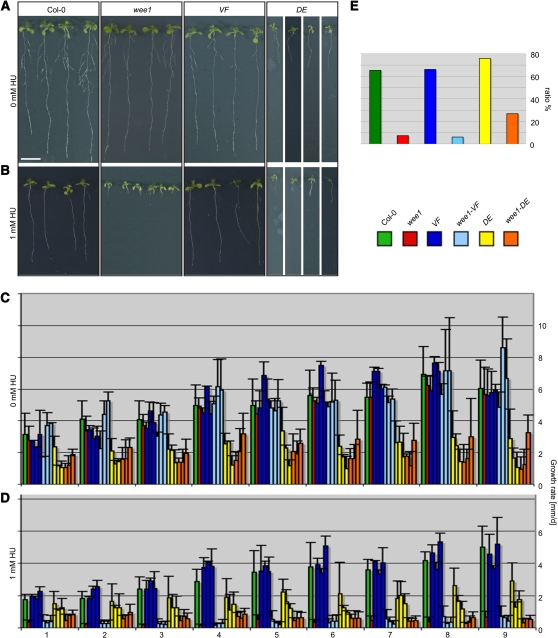
Entry into mitosis is universally controlled by cyclin-dependent kinases (CDKs). A key regulatory event in metazoans and fission yeast is CDK activation by the removal of inhibitory phosphate groups in the ATP binding pocket catalyzed by Cdc25 phosphatases. In contrast with other multicellular organisms, we show here that in the flowering plant Arabidopsis thaliana, cell cycle control does not depend on sudden changes in the phosphorylation pattern of the PSTAIRE-containing Cdk1 homolog CDKA;1. Consistently, we found that neither mutants in a previously identified CDC25 candidate gene nor plants in which it is overexpressed display cell cycle defects. Inhibitory phosphorylation of CDKs is also the key event in metazoans to arrest cell cycle progression upon DNA damage. However, we show here that the DNA damage checkpoint in Arabidopsis can also operate independently of the phosphorylation of CDKA;1. These observations reveal a surprising degree of divergence in the circuitry of highly conserved core cell cycle regulators in multicellular organisms. Based on biomathematical simulations, we propose a plant-specific model of how progression through the cell cycle could be wired in Arabidopsis.


Figures

Figure 1.
Figure 1.
Rosette Morphology of CDKA;1 Variants and Their Combination with pas2/pep and wee1. (A) Strongly reduced growth of 3-week-old DE and wee1-DE plants in comparison to the wild-type (Columbia-0 [Col-0]) and VF plants of the same age. (B) Characteristic callus-like overproliferation phenotype of 3-week-old pas2/pep seedlings grown on agar plates. In the triple mutant pas2/pep-DE, the pas2/pep phenotype is not restored. (C) Close-ups of pas2/pep and pas2/pep-DE from (B). Bars = 1 cm in (A) and (B) and 1 mm in (D).
Figure 2.
Figure 2.
Analysis of Pollen Phenotypes. (A) to (C) DAPI staining of pollen grains. Bars = 10 μm. (A) Wild-type pollen at anthesis, consisting of three cells: two sperm cells, with two bright and condensed nuclei, embedded in one giant vegetative cell with a large and diffuse nucleus. (B) Heterozygous cdka;1 mutants with approximately half of the pollen containing only a single sperm cell-like cell. (C) In heterozygous cdka;1 mutants harboring two copies of the DE construct, both wild-type and mutant pollen (asterisks) can be found, indicating the reduced activity of DE. (D) Quantification of pollen phenotypes. See Methods for genotype descriptions. The number of pollen scored for each genotype is shown at the top of each graph; DE and wee1-DE are heterozygous for cdka;1. #1, 2, and 3 are individual T3 lines from independent transformation events.
Figure 3.
Figure 3.
Analysis of Root Growth. (A) and (B) Wild-type (Col-0), wee1, VF, and DE plants were germinated and grown for 10 d (A) on Murashige and Skoog (MS) medium (A) and on MS medium containing 1 mM HU (B). The DE plants were compiled from a segregating population because homozygous DE plants are sterile. Bar in (A) = 1 cm. (C) and (D) Kinematic analysis of the root growth rate of seedlings grown on MS plates without and with HU for 10 d after germination (abscissa, 1 = growth from day 1 to day 2, etc.). Error bars represent sd of the following data (0 mM HU: replicates/individuals per replicate/1 mM HU: replicates/individuals per replicate): Col-0 (5/49//4/36), wee1 (5/51//3/31), VF #1 (3/30//3/28), VF #2 (2/11//2/14), VF #3 (3/25//3/24), DE #1 (4/34//4/25), DE #2 (2/23//2/20), DE #3 (4/17//3/18), wee1-VF #1 (2/11//2/23), wee1-VF #2 (3/33//3/32), wee1-VF #3 (3/34//3/29), wee1-DE #1 (2/12//3/2), wee1-DE #2 (3/16//3/12), and wee1-DE #4 (5/35//5/27). Root length was measured from the root tip until the root-hypocotyl border. The mean of the root lengths of each individual experiment was determined and again averaged for the replicates. (E) Ratio of the mean growth rates on 1 mM HU/0 mM HU of the intervals 4 to 7. The values of the individual sublines #1, #2, and #3 were averaged. Quantification of the final root length after 10 d is shown in Supplemental Figures 3A and 3B online.
Figure 4.
Figure 4.
Leaf Morphology and Trichome Branching of CDKA;1 Variants. (A) Distinct overall leaf morphology of DE (bottom row) from that of wild-type plants (top row). Leaves of DE plants are small with a serrated shape; see also Figure 1. (B) Scanning electron micrographs of leaf surfaces of the same genotypes showing less-branched trichomes (leaf hairs) of DE plants (IV) than those of the wild type (I), wee1 (II), or VF (III). (C) Scanning electron microscopy close-ups of the epidermis of DE (IV) that contains fewer but much larger cells than Col-0 (I), wee1 (II), or VF (III). (D) Quantification of trichome branch numbers. Same genotypes as in Figure 2 unless indicated; number of trichomes scored for each genotype is shown below the color legend (for wt, DE and VF, two individual T3 lines [#1 and #2] from independent transformation events were investigated). Bars = 1 cm in (A), 20 μm in (B), and 100 μm in (C).
Figure 5.
Figure 5.
Determination of Ploidy and DNA Content. (A) Flow cytometry of Arabidopsis leaves. For ploidy analysis of each genotype, three independent preparations of pooled leaf material (young [top row, leaves 1 plus 2] and mature [bottom row, leaves 3 plus 4]) of five individuals each were investigated in triplicates. For the transgenics DE and VF as well as for the combinations wee1-DE and wee1-VF, three independent transformants (DE and VF #1, #2, or #3) were investigated homozygous for cdka;1. For each profile, 10,000 events were counted. Numbers below the peaks indicate the ploidy (or C-) level. (B) Details of DAPI-stained leaves in which nuclear morphology and size of stomata (st) in DE and VF is indistinguishable from those of the wild type, whereas the endoreplication of trichomes (tr) is reduced in DE. Individuals were grown under identical conditions for 3 weeks.
Figure 6.
Figure 6.
Kinase Activity of CDKA;1 Variants. In vitro histone H1 kinase assays of CDKA;1-cyclin complexes from crude extracts of flower buds. [γ-33P] was used as phosphorylation probe. As a loading control, CDKA;1 protein levels were visualized using α-PSTAIRE antibody.
Figure 7.
Figure 7.
Stability, Localization, and Interaction of CDKA;1 Variants. (A) Wild-type CDKA;1 interacts in bimolecular fluorescence complementation assays with nonsubstrate interactors, such as CYCLIN D3;1 (I) or CDK-SUBUNIT 1 (II), and with putative substrates, such as CDC6 (III). Bar = 50 μm. (B) Quantification of the relative fluorescence intensities. Error bars in the graph indicate sd from at least three independent experiments. [See online article for color version of this figure.]
Figure 8.
Figure 8.
Cell Cycle Simulations. Numerical simulations are based on a eukaryotic cell cycle model (Tyson and Novak, 2001), and the relative activity levels (0 to 1) of major cell cycle regulators are plotted versus time with the same time window shown in each panel; approximate cell cycle phases are given under each panel. (A) Cell cycle control with inhibitory phosphorylation of mitosis promoting factor (MPF): S phase and M phase start when the CDKA activities of S phase promoting factor (SPF) and MPF abruptly rise from their low level. The long period between SPF and MPF activation represents the sum of S and G2 phases of the cycle. (B) Cell cycle control without inhibitory Tyr-15 phosphorylation of MPF: in its absence, MPF activity rises soon after SPF and initiates mitosis prematurely without any G2 phase. (C) MPF activation with rate-limiting cyclin availability: by assuming that the synthesis (or degradation) of cyclin of MPF (called MPF*) depends on MPF activity, a G2 phase can be established. (D) MPF regulation by G2 phase–specific CDK inhibitors (CKI*): a stoichiometrically acting CKI can delay MPF activation instead of inhibitory phosphorylations onto CDK-cyclin complexes.

Similar articles

Cited by

References

    1. Amon, A., Surana, U., Muroff, I., and Nasmyth, K. (1992). Regulation of p34CDC28 tyrosine phosphorylation is not required for entry into mitosis in S. cerevisiae. Nature 355 368–371. - PubMed
    1. Andersen, S.U., Buechel, S., Zhao, Z., Ljung, K., Novak, O., Busch, W., Schuster, C., and Lohmann, J.U. (2008). Requirement of B2-type cyclin-dependent kinases for meristem integrity in Arabidopsis thaliana. Plant Cell 20 88–100. - PMC - PubMed
    1. Araki, S., Ito, M., Soyano, T., Nishihama, R., and Machida, Y. (2004). Mitotic cyclins stimulate the activity of c-Myb-like factors for transactivation of G2/M phase-specific genes in tobacco. J. Biol. Chem. 279 32979–32988. - PubMed
    1. Atherton-Fessler, S., Parker, L.L., Geahlen, R.L., and Piwnica-Worms, H. (1993). Mechanisms of p34cdc2 regulation. Mol. Cell. Biol. 13 1675–1685. - PMC - PubMed
    1. Bach, L., et al. (2008). The very-long-chain hydroxy fatty acyl-CoA dehydratase PASTICCINO2 is essential and limiting for plant development. Proc. Natl. Acad. Sci. USA 105 14727–14731. - PMC - PubMed

Publication types

MeSH terms