. 2010 Feb;20(2):212-27.
doi: 10.1101/gr.095406.109. Epub 2009 Nov 30.

Population dynamics of PIWI-interacting RNAs (piRNAs) and their targets in Drosophila

Affiliations

Population dynamics of PIWI-interacting RNAs (piRNAs) and their targets in Drosophila

Jian Lu et al. Genome Res. 2010 Feb.

Abstract

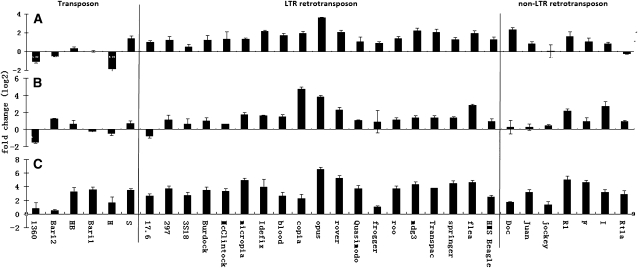
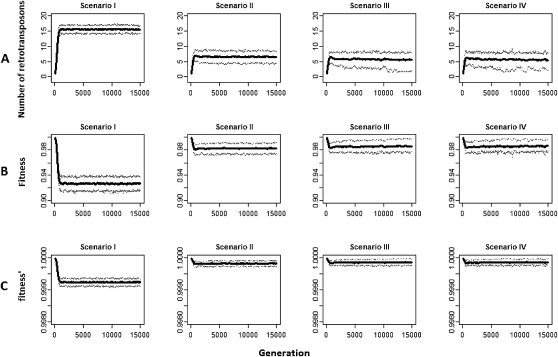
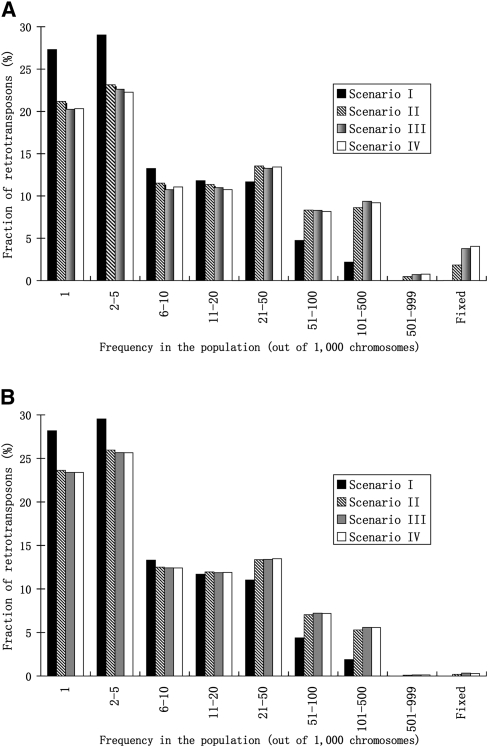
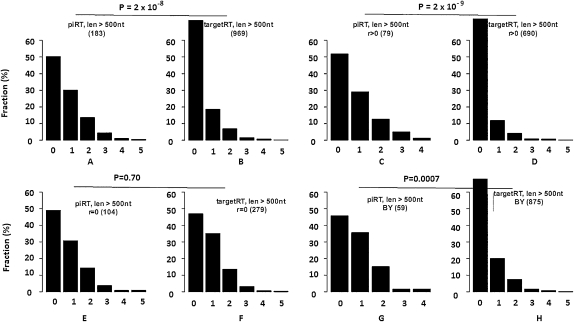
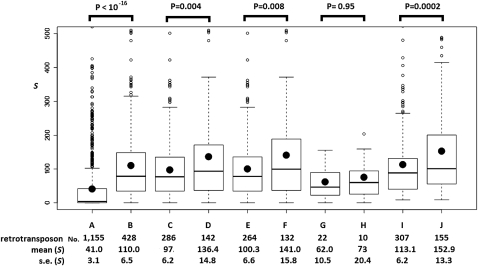
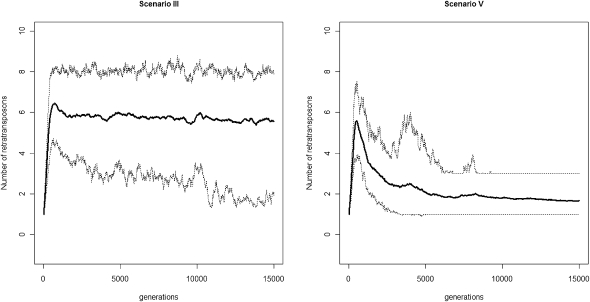
Transposable elements (TEs) are mobile DNA sequences that make up a large fraction of eukaryotic genomes. Recently it was discovered that PIWI-interacting RNAs (piRNAs), a class of small RNA molecules that are mainly generated from transposable elements, are crucial repressors of active TEs in the germline of fruit flies. By quantifying expression levels of 32 TE families in piRNA pathway mutants relative to wild-type fruit flies, we provide evidence that piRNAs can severely silence the activities of retrotransposons. We incorporate piRNAs into a population genetic framework for retrotransposons and perform forward simulations to model the population dynamics of piRNA loci and their targets. Using parameters optimized for Drosophila melanogaster, our simulation results indicate that (1) piRNAs can significantly reduce the fitness cost of retrotransposons; (2) retrotransposons that generate piRNAs (piRTs) are selectively more advantageous, and such retrotransposon insertions more easily attain high frequency or fixation; (3) retrotransposons that are repressed by piRNAs (targetRTs), however, also have an elevated probability of reaching high frequency or fixation in the population because their deleterious effects are attenuated. By surveying the polymorphisms of piRT and targetRT insertions across nine strains of D. melanogaster, we verified these theoretical predictions with population genomic data. Our theoretical and empirical analysis suggests that piRNAs can significantly increase the fitness of individuals that bear them; however, piRNAs may provide a shelter or Trojan horse for retrotransposons, allowing them to increase in frequency in a population by shielding the host from the deleterious consequences of retrotransposition.


Figures

Figure 1.
Figure 1.
Fold changes of TE mRNAs in piRNA pathway mutants relative to the wild type. The x-axis provides the names of the 32 TE families tested, and the y-axis is the log2 value of the fold changes. (A) piwi06843/CyO; (B) aubQC42/CyO; (C) aubHN/CyO. In each panel, the horizontal line at 0 represents the case when the expression level is the same in the mutants and wild-type flies. Three replicates were performed, and the average values ± standard errors are presented.
Figure 2.
Figure 2.
The number of retrotransposons carried by one chromosome and the fitness costs to the host. (A) The number of retrotransposons carried by one chromosome. (B) The fitness of the host using the scaled a and b values in the simulations. (C) The fitness of the host using the unscaled a and b values. In scenario I, piRNAs have no repression effect on the activities of their targets. In scenarios II, III, and IV, piRNAs reduce a retrotransposon's retrotransposition rates to 10%, 1%, and 0.1% of its original rate, respectively. The solid line in each panel is the mean value, and the thin dashed lines represent the upper and lower 90% confidence bounds (Ne = 1000, a = 0.001, b = 0.0005, r = 2.5 × 10⁻⁸, u1 = 0.01, v = 0, after scaling for all the four scenarios, where Ne is the effective number of individuals, a and b are constants in the quadratic fitness function, u1 is the retrotransposition rate for each retrotransposon outside piRNA regions in the cells where piRNA is not expressed, v is the excision rate, and r is the recombination rate per nucleotide per generation; u2 is the retrotransposition rate for each retrotransposon outside piRNA regions in the cells where piRNA is expressed, u2 = 0.01, 0.001, 0.0001, and 0.00001, after scaling for scenarios I, II, III, and IV, respectively). In C, a = 10−5 and b = 5 × 10⁻⁶ were used in the quadratic fitness function.
Figure 3.
Figure 3.
The dynamics over time (generations) of the mean proportion (%) of all retrotransposons that are piRTs (Ne = 500, a = 0.001, b = 0.0005, r = 2.5 × 10⁻⁸, u1 = 0.01, v = 0, after scaling for all four scenarios; u2 = 0.01, 0.001, 0.0001, and 0.00001, after scaling for scenarios I–IV, respectively).
Figure 4.
Figure 4.
(A) Retrotransposon insertions that generate piRNAs (piRT insertions) have a higher probability of fixation or of attaining high frequency in the population because of their relatively advantageous effects. (B) Retrotransposon insertions that are repressed by piRNAs (targetRT insertions) also have a higher probability to be fixed or attain high frequency, because their deleterious effects are (partially) alleviated by piRNAs. (Ne = 500, a = 0.001, b = 0.0005, r = 2.5 × 10⁻⁸, u1 = 0.01, v = 0, after scaling for all four scenarios; u2 = 0.01, 0.001, 0.0001, and 0.00001, after scaling for scenarios I–IV, respectively, for both A and B.)
Figure 5.
Figure 5.
Frequency spectra of retrotransposons and other TEs. (A vs. B) The frequency spectra of piRT insertions are significantly skewed to higher frequencies than those of the targetRT insertions (only retrotransposons longer than 500 nt are considered). The difference in frequency spectra is statistically significant in the regions where recombination occurred (C vs. D), but vanishes in regions where recombination does not occur (E vs. F). (G vs. H) The difference in frequency spectra of piRT versus targetRT insertions is statistically significant if we use the piRNA loci defined by both Brennecke et al. (2007) and Yin and Lin (2007). (BY) piRNA locus defined by both Brennecke et al. (2007) and Yin and Lin (2007). The numbers in parentheses are the number of retrotransposons in that category. The x-axis is the frequency of insertion out of the nine strains of D. melanogaster. “0” means the insertion is only restricted in the reference genome of D. melanogaster. The y-axis is the proportion (%) of retrotransposon insertions with distinct frequency across the nine strains.
Figure 6.
Figure 6.
The boxplots of S scores for targetRTs (retrotransposons that are outside piRNA loci). (A) Nonautonomous/inactive retrotransposons. (B–H) Putatively autonomous targetRTs: (B) total putatively autonomous targetRTs; (C) rare autonomous targetRT insertions (the insertions only exist in the reference genome); (D) common autonomous targetRT insertions (the insertions exist in the reference genome and in at least one strain surveyed in this study or Gonzalez et al. 2008); (E) rare autonomous targetRT insertions in regions where recombination occurs; (F) common autonomous targetRT insertions in regions where recombination occurs; (G) rare autonomous targetRT insertions in nonrecombining regions; (H) common autonomous targetRT insertions in nonrecombining regions. The S scores of A–H are based on the small RNAs from the four piRNA libraries that are located inside the piRNA loci and perfectly antisense to TEs annotated in FlyBase R5.13 (see text). (I,J) S scores for all the putatively autonomous retrotransposons (inside and outside piRNA loci) with all the small RNAs in the four libraries (they can be inside piRNA loci or not). (I) The rare class; (J) the common class. The number of retrotransposon insertions in each category, the mean and standard error (SE) of S scores for each category appears below each boxplot. Kolmogorov-Smirnov tests were used to assess the statistical significance, and the P-values appear above the boxplots. In each boxplot, the minimum, 25%, 50%, and 75% quantiles, and the maximum S scores are represented by horizontal lines. The black dot is the mean S score. S scores greater than 500 are not plotted.
Figure 7.
Figure 7.
Simulation results indicate that reducing recombination rates of piRNA loci can greatly reduce the number of retrotransposons carried in the genome. Under scenario III, the piRNAs can repress the activities of targetRTs to 1% of their original level, and piRTs have the same recombination rates as targetRTs; under scenario V, the same parameter settings were used as under scenario III except that there was no recombination on the piRTs so that piRTs do not contribute to the fitness cost of retrotransposons because they do not retrotranspose or get involved into ectopic recombination. At equilibrium, the mean number of retrotransposons carried on one chromosome is approximately six under scenario III, while it is fewer than two under scenario V (Ne = 1000, a = 0.001, b = 0.0005, r = 2.5 × 10⁻⁸, u1 = 0.01, u2 = 0.0001, and v = 0, after scaling for both scenarios III and V).

Similar articles

Cited by

References

    1. Allen E, Xie Z, Gustafson AM, Sung GH, Spatafora JW, Carrington JC. Evolution of microRNA genes by inverted duplication of target gene sequences in Arabidopsis thaliana. Nat Genet. 2004;36:1282–1290. - PubMed
    1. Aminetzach YT, Macpherson JM, Petrov DA. Pesticide resistance via transposition-mediated adaptive gene truncation in Drosophila. Science. 2005;309:764–767. - PubMed
    1. Aravin AA, Naumova NM, Tulin AV, Vagin VV, Rozovsky YM, Gvozdev VA. Double-stranded RNA-mediated silencing of genomic tandem repeats and transposable elements in the D. melanogaster germline. Curr Biol. 2001;11:1017–1027. - PubMed
    1. Aravin AA, Hannon GJ, Brennecke J. The Piwi–piRNA pathway provides an adaptive defense in the transposon arms race. Science. 2007;318:761–764. - PubMed
    1. Ashburner M, Bergman CM. Drosophila melanogaster: A case study of a model genomic sequence and its consequences. Genome Res. 2005;15:1661–1667. - PubMed

Publication types

MeSH terms

Substances

LinkOut - more resources