. 2009 Dec 15;106(50):21173-8.
doi: 10.1073/pnas.0910774106. Epub 2009 Nov 30.

A theory of microtubule catastrophes and their regulation

Affiliations

A theory of microtubule catastrophes and their regulation

Ludovic Brun et al. Proc Natl Acad Sci U S A. .

Abstract

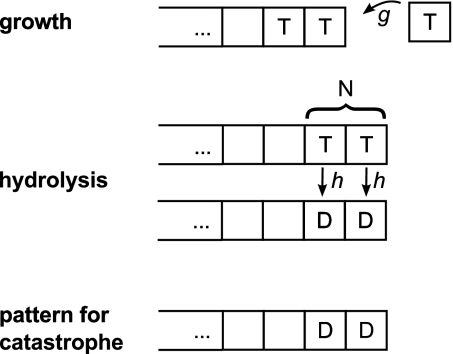
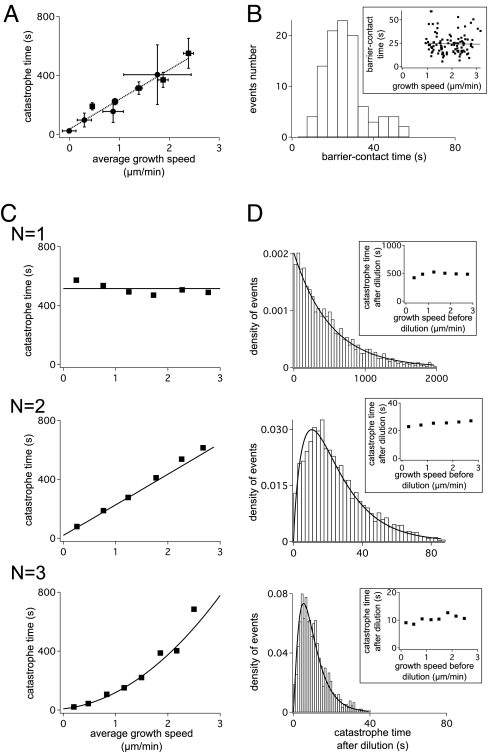
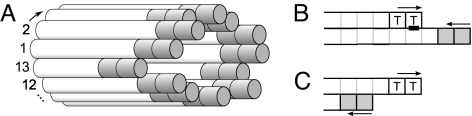
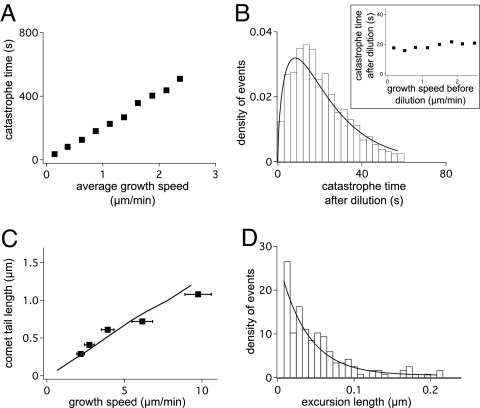
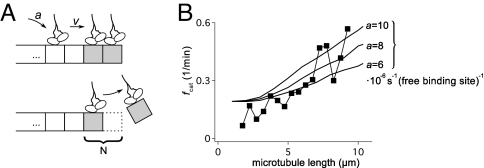
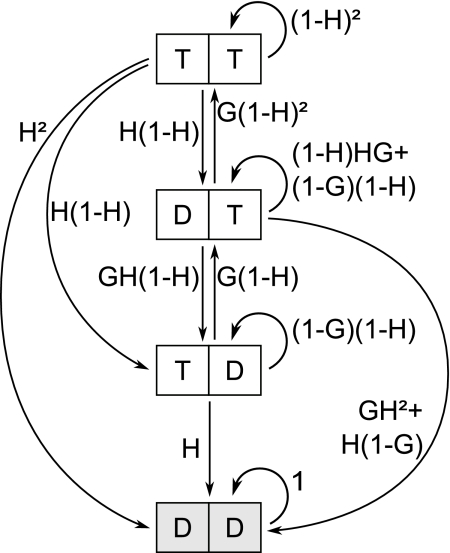
Dynamic instability, in which abrupt transitions occur between growing and shrinking states, is an intrinsic property of microtubules that is regulated by both mechanics and specialized proteins. We discuss a model of dynamic instability based on the popular idea that growth is maintained by a cap at the tip of the fiber. The loss of this cap is thought to trigger the transition from growth to shrinkage, called a catastrophe. The model includes longitudinal interactions between the terminal tubulins of each protofilament and "gating rescues" between neighboring protofilaments. These interactions allow individual protofilaments to transiently shorten during a phase of overall microtubule growth. The model reproduces the reported dependency of the catastrophe rate on tubulin concentration, the time between tubulin dilution and catastrophe, and the induction of microtubule catastrophes by walking depolymerases. The model also reproduces the comet tail distribution that is characteristic of proteins that bind to the tips of growing microtubules.


Conflict of interest statement

The authors declare no conflict of interest.

Figures

Fig. 1.
Fig. 1.
The dynamics of the protective cap are determined by the addition of GTP-loaded units (T) at the tip (Top) and hydrolysis of GTP to GDP (D). Hydrolysis occurs spontaneously within the fiber for each T-unit independently of its surroundings (Middle). Addition and spontaneous hydrolysis occur stochastically with rates g and h, respectively. A protofilament undergoes catastrophe as soon as the N-terminal units are in GDP configuration (Bottom). Units outside of the region defined by the coupling parameter N are not considered.
Fig. 2.
Fig. 2.
Experimental measurements (A and B) and results of the 1D model for several values of N (C and D). In A and C, the average catastrophe time is shown for different microtubule speeds under conditions of constant growth. B and D correspond to a dilution experiment, where assembly stops because monomers suddenly become unavailable. This occurs either because the monomers have been removed by dilution or the microtubule tip is stalled by pushing it against a barrier. (A) Experimental data measured by application of a force (circles) or variation of tubulin concentration (squares), and linear fit (dashed line) from ref. . (B) Histogram of catastrophe time obtained after the growth is halted by force (16). (Inset) Average catastrophe time as a function of growth speeds v0 before stalling (16). (C) Catastrophe time calculated by averaging 1,000 simulations (points) and derived analytically (lines). h = 0.002, 0.058, and 0.16 s−1 for N = 1, 2, and 3 respectively. Error bars are omitted for clarity. (D) Normalized catastrophe time distributions for v0 = 2.4 μm/min obtained from 1,000 simulations and analytical fit (lines, α = 1, 1.32, and 2.3 for N = 1, 2 and, 3 respectively; see Materials and Methods). (Insets) The dependence of average catastrophe time on the growth speed before dilution.
Fig. 3.
Fig. 3.
Schematic representation of composite model and gating rescue interactions. (A) Each protofilament is in contact with two neighbors. (B) GTP units rescue neighboring shrinking protofilaments (black bar). Thus, the short-lived shrinkage event will not affect the overall microtubule state. (C) The shortest protofilament cannot be rescued by this mechanisms and consequently will trigger a microtubule catastrophe.
Fig. 4.
Fig. 4.
Results of the composite microtubule model and experimental evidence (see also Fig. S1). (A and B) Catastrophes are calculated as described in Fig. 2, except that the histogram in B is summed over a range of growth speeds v0 ∈ [0,3] μm/min. Each simulated data point is an average of 1,000 independent simulations. The hydrolysis parameter h is 0.029 s−1 for all simulations. (C) Extension of +TIP proteins at the microtubule tip, as function of growth speed. The experimental Mal3 comet size (squares; from ref. 23) can be compared with the distribution of GTP units with respect to the longest protofilament (black line), averaged from 8,000 simulations. (D) Excursion length distribution for a microtubule growing at a rate g = 1 s−1. The best exponential fit (line) yields a mean excursion length of 38 nm.
Fig. 5.
Fig. 5.
Induction of catastrophe by a walking depolymerase. (A) In the model, depolymerizing kinesin such as kinesin-8 (18, 19) can bind anywhere on the microtubule lattice with rate a. They walk processively to the plus end with speed v. They stall at the plus end but are pushed by the motor that arrives subsequently, upon which they detach, removing the terminal tubulin unit of the microtubule, such that N − 1 hydrolysis events are now sufficient to induce catastrophe. (B) Effect of the attachment rate a on the catastrophe rate. A total of 700 kinesins are simulated with a speed v = 3 μm/min, and the fiber growth speed is 1.5 μm/min. Different kinesin attachment rates are shown (expressed in number of attachments per s and per unoccupied binding site). For each attachment rate 5 × 10⁴ simulations were averaged. The experimental curve (squares) was measured in S. pombe cells (20).
Fig. 6.
Fig. 6.
State transition diagram for the 1D model with N = 2. The rectangles represent the possible states for the two terminal tubulin units, with transitions indicated by arrows. The probabilities of each transition for a time τ are calculated from G = g τ and H = h τ, where g and h are the rates to grow and hydrolyze, respectively. The state DD (in gray) is called the absorbing state, because no transition leaves from it.

References

    1. Mitchison T, Kirschner M. Dynamic instability of microtubule growth. Nature. 1984;312:237–242. - PubMed
    1. Kirschner M, Mitchison T. Beyond self-assembly: From microtubules to morphogenesis. Cell. 1986;45:329–342. - PubMed
    1. Hill TL. Linear Aggregation Theory in Cell Biology. New York: Springer; 1987.
    1. Bayley PM, Schilstra MJ, Martin SR. A simple formulation of microtubule dynamics: Quantitative implications of the dynamic instability of microtubule populations in vivo and in vitro. J Cell Sci. 1989;93:241–254. - PubMed
    1. Verde F, Dogterom M, Stelzer E, Karsenti E, Leibler S. Control of microtubule dynamics and length by cyclin A- and cyclin B-dependent kinases in Xenopus egg extracts. J Cell Biol. 1992;118:1097–1108. - PMC - PubMed

Publication types

LinkOut - more resources