. 2010 Jan 1;184(1):30-4.
doi: 10.4049/jimmunol.0903412. Epub 2009 Nov 30.

Cutting edge: the Th1 response inhibits the generation of peripheral regulatory T cells

Affiliations

Cutting edge: the Th1 response inhibits the generation of peripheral regulatory T cells

David Caretto et al. J Immunol. .

Abstract

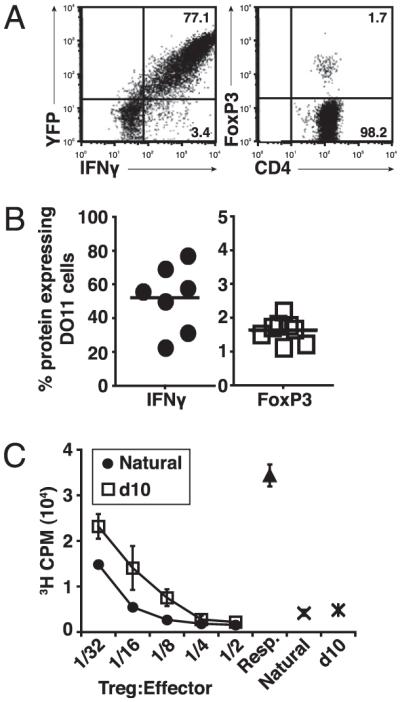
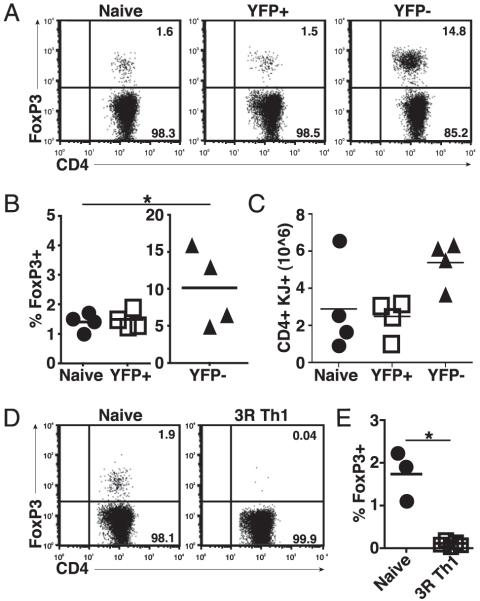
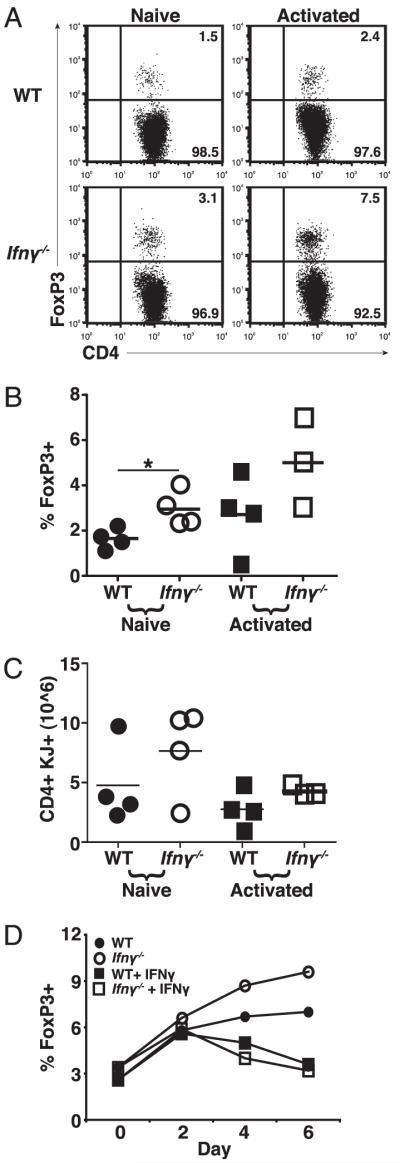
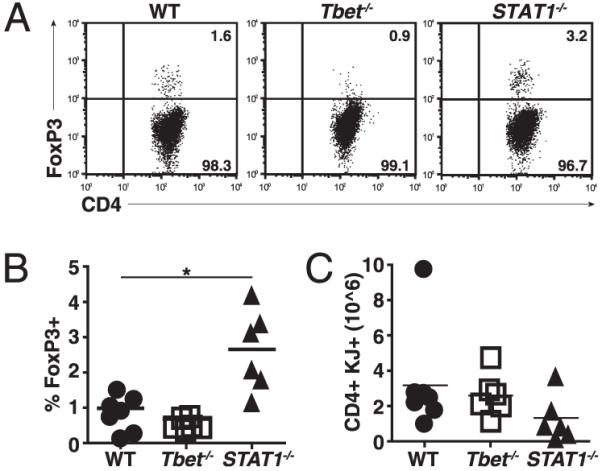
The possibility that effector T cells can be converted into forkhead box P3(+) regulatory T cells (Tregs) has potential therapeutic implications. To analyze the relationship between Th1 effectors and Tregs, we have used a model of systemic autoimmunity in which both effector and Tregs arise from a single population specific for a transgene-encoded systemic protein. In vitro, the presence of IFN-gamma inhibits Treg generation during activation. Using IFN-gamma reporter mice, we demonstrate that IFN-gamma-producing cells tend not to develop into Tregs, and Th1 priming of T cells prior to cell transfer limits the number of forkhead box P3(+) T cells generated in vivo. Moreover, transfer of IFN-gamma(-/-) or STAT1(-/-) T cells resulted in an increase in the number of Tregs. These data support a role for Th1 effector molecules and transcription factors in the control of peripheral Treg generation and demonstrates the limited plasticity of Th1 populations.


Figures

FIGURE 1
FIGURE 1
Relationship of IFN-γ–producing effector cells and Foxp3+ Tregs. A, Naive CD4+ T cells from DO11.10 Yeti mice were sorted and adoptively transferred into sOVARag−/− recipients. Lymph nodes were harvested 10 d post transfer. Representative FACS plots of IFN-γ and Foxp3 gated on DO11.10 cells. B, Cumulative data from four experiments for the percentage of IFN-γ+ or Foxp3+ cells; note the difference in scales. C, Naive T cells from DO11.10 Foxp3-GFP reporter mice were sorted and adoptively transferred into sOVARag−/− recipients. GFP+ Tregs cells were sorted 10 d post transfer (d10 Tregs) and compared with GFP+ Tregs from DO11.10 Foxp3-GFP reporter mice (natural). These cells were cultured with CD4+CD25 (responder) cells from DO11.10/Rag−/− mice and mitomycin-treated APCs for 72 h. Data are representative of two comparable experiments.
FIGURE 2
FIGURE 2
Reduced Treg development from IFN-γ–producing cells. Naive CD4+ T cells from DO11.10 Yeti mice were sorted and cultured under Th1 conditions. After 5 d, cells were sorted into YFP and YFP+ populations and transferred into sOVARag−/− recipients; for comparison, freshly sorted naive cells were also transferred. Lymph nodes were harvested 10 d post transfer. A, Representative FACS plots show Foxp3 expression gated on DO11.10 cells. B, The percentage of Foxp3+ T cells for three experiments (note the difference in scales). C, The number of Foxp3+ T cells for three experiments. D, Naive CD4+ T cells from WT DO11.10 mice were sorted and cultured under Th1 conditions for three rounds of stimulation (3R Th1) and transferred into sOVARag−/− recipients. Lymph nodes were harvested 10 d post transfer. Representative FACS plots are shown gated on DO11.10 cells. E, The number of Foxp3+ T cells for three experiments.
FIGURE 3
FIGURE 3
IFN-γ inhibits development of Foxp3+ cells. A, Naive T cells from WT and IFN-γ−/− DO11.10 mice were cultured in activating conditions for 5 d and then transferred to sOVARag−/− recipients; for comparison, freshly sorted naive cells were also transferred. Lymph nodes were harvested 10 d post transfer. A, Representative plots of Foxp3+ T cells gated on DO11.10 cells. B, The percentage of Foxp3+ T cells for three experiments. C, The number of Foxp3+ T cells for three experiments. D, Naive CD4+ T cells from WT and IFN-γ−/− DO11.10 mice were cultured in activating conditions ± exogenous IFN-γ for Foxp3 expression on days 2, 4, and 6. Data are representative of two experiments.
FIGURE 4
FIGURE 4
STAT1 but not Tbet inhibits peripheral Treg generation. Naive CD4+ T cells from WT, Tbet−/−, or STAT1−/− DO11.10 mice were sorted, cultured under Th1 conditions, and transferred to sOVARag−/− recipients. Lymph nodes were harvested 10 d post transfer. A, Representative plots of Foxp3 stains gated on DO11.10. B, The percentage of Foxp3+ T cells for three experiments. C, The number of Foxp3+ T cells from three experiments.

Similar articles

Cited by

References

    1. Fontenot JD, Rasmussen JP, Williams LM, Dooley JL, Farr AG, Rudensky AY. Regulatory T cell lineage specification by the forkhead transcription factor foxp3. Immunity. 2005;22:329–341. - PubMed
    1. Maloy KJ, Powrie F. Regulatory T cells in the control of immune pathology. Nat. Immunol. 2001;2:816–822. - PubMed
    1. Shevach EM. CD4+ CD25+ suppressor T cells: more questions than answers. Nat. Rev. Immunol. 2002;2:389–400. - PubMed
    1. Grogan JL, Mohrs M, Harmon B, Lacy DA, Sedat JW, Locksley RM. Early transcription and silencing of cytokine genes underlie polarization of T helper cell subsets. Immunity. 2001;14:205–215. - PubMed
    1. Mullen AC, Hutchins AS, Villarino AV, Lee HW, High FA, Cereb N, Yang SY, Hua X, Reiner SL. Cell cycle controlling the silencing and functioning of mammalian activators. Curr. Biol. 2001;11:1695–1699. - PubMed

Publication types