. 2010 Jan 1;184(1):56-66.
doi: 10.4049/jimmunol.0902379. Epub 2009 Nov 30.

CD4(+) CD25(+) Foxp3(+) T regulatory cells with limited TCR diversity in control of autoimmunity

Affiliations

CD4(+) CD25(+) Foxp3(+) T regulatory cells with limited TCR diversity in control of autoimmunity

Dennis Adeegbe et al. J Immunol. .

Abstract

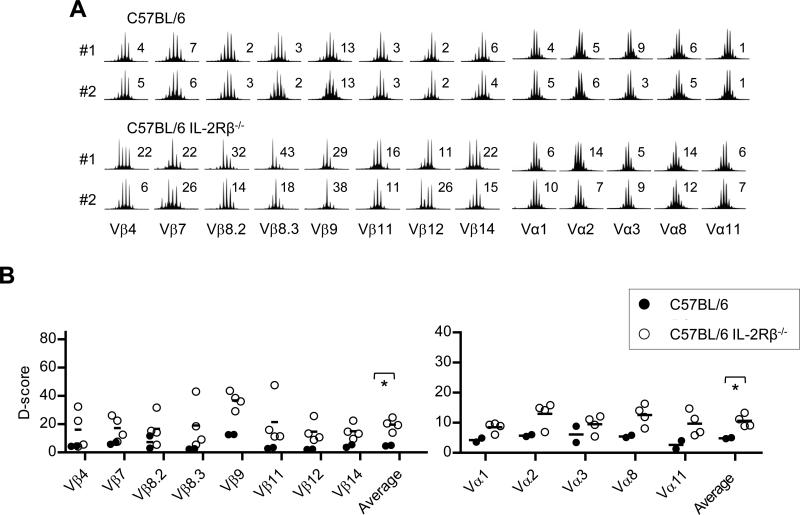
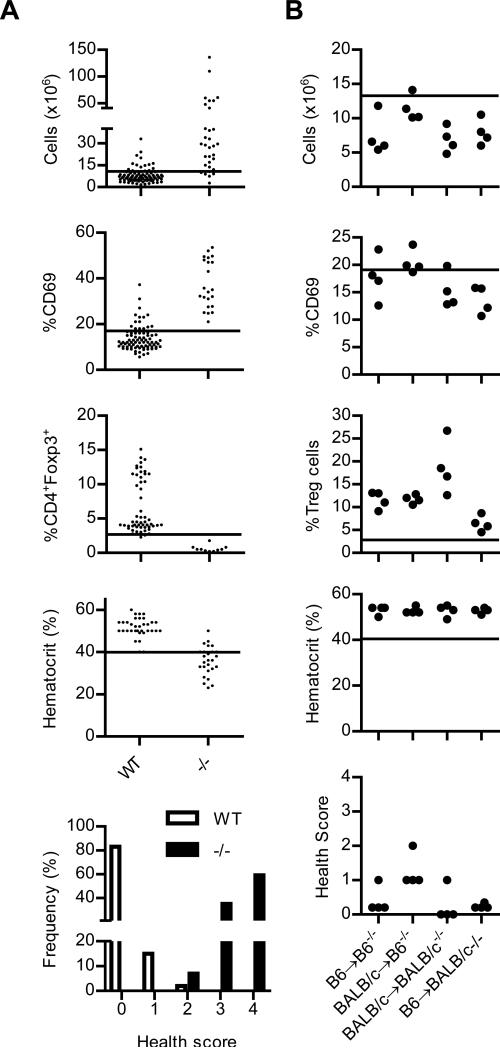
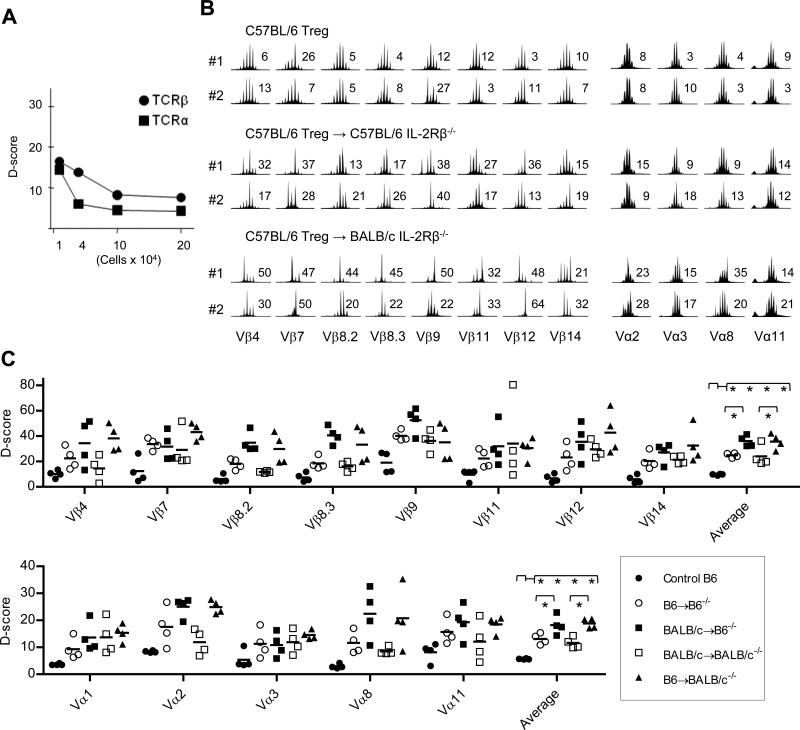
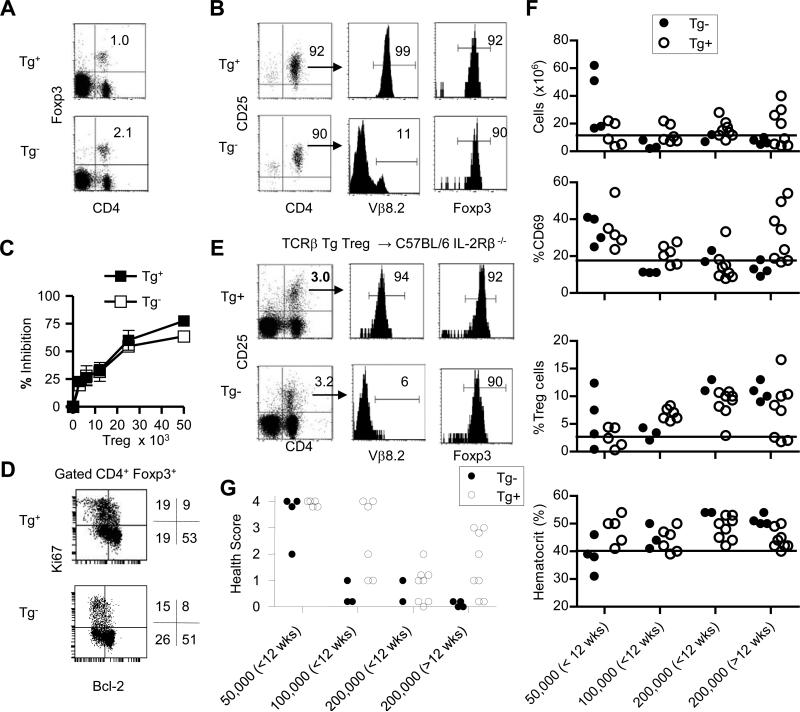
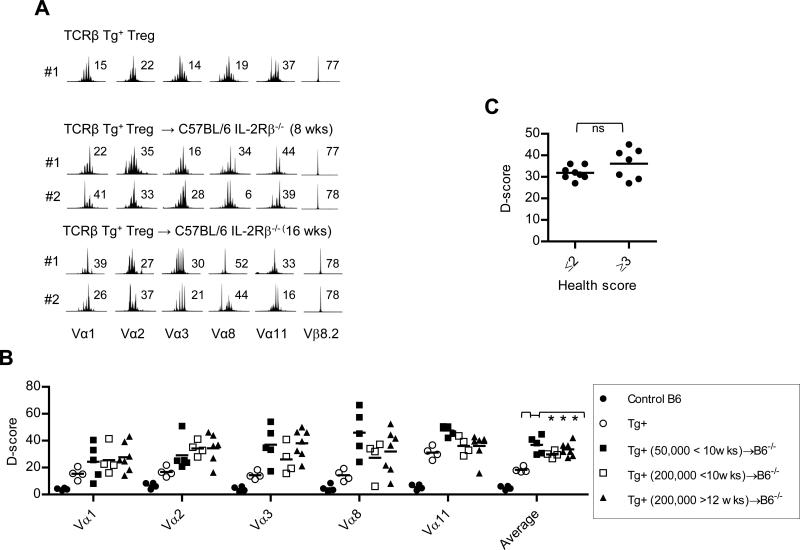
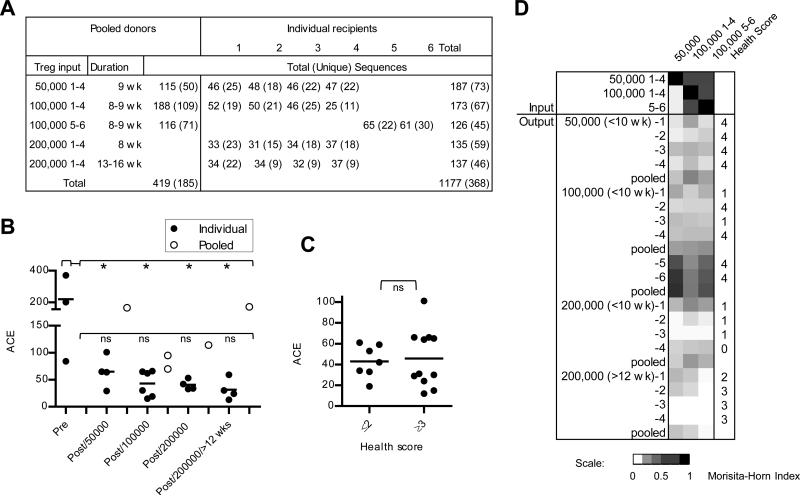
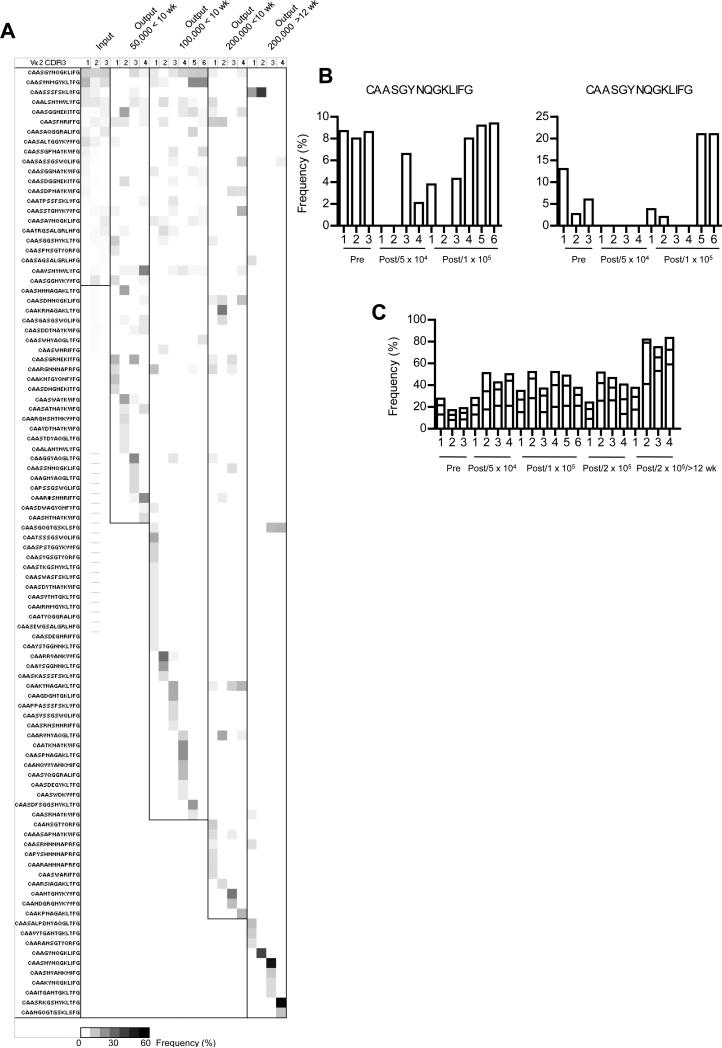
The importance of high TCR diversity of T regulatory (Treg) cells for self-tolerance is poorly understood. To address this issue, TCR diversity was measured for Treg cells after transfer into IL-2Rbeta(-/-) mice, which develop lethal autoimmunity because of failed production of Treg cells. In this study, we show that high TCR diversity of pretransferred Treg cells led to selection of therapeutic Treg cells with lower TCR diversity that prevented autoimmunity. Pretransferred Treg cells with lower diversity led to selection of Treg cells through substantial peripheral reshaping with even more restricted TCR diversity that also suppressed autoimmune symptoms. Thus, in a setting of severe breakdown of immune tolerance because of failed production of Treg cells, control of autoimmunity is achieved by only a fraction of the Treg TCR repertoire, but the risk for disease increased. These data support a model in which high Treg TCR diversity is a mechanism to ensure establishing and maintaining self-tolerance.


Figures

Fig. 1
Fig. 1. TCR diversity of autoreactive T cells from individual IL-2Rβ-/- mice
CD4+ T cells were isolated from 3-5 week old WT C57BL/6 (control B6) or IL-2Rβ-/- (B6-/-) mice. (A) Representative TCR Vβ and Vα spectratype analysis for CDR3 for the indicated Vβ and Jβ1.1 gene segments or Vα subfamily and Cα gene segment. The D-score is shown to the right of each spectratype profile. (B) D-scores for Vβ and Vα spectratype distribution profiles for all mice (n=4). Data for the averaged D-scores were compared by unpaired one-tailed t-test.
Fig. 2
Fig. 2. Health status of IL-2Rβ-/- mice that were adoptively transferred with syngeneic or allogeneic Treg cells
(A) LN cellularity, expression of CD69 by peripheral CD4+ T cells, % CD4+ Foxp3+ Treg cells in the LN, and the hematocrit were recorded from a historical data base and concurrent C57BL/6 IL-2Rβ+/+ or +/- (WT; n=99; median age, 12 wks) or IL-2Rβ -/- (-/-; n=34; median age, 4 wks) mice. 14 data points for the WT group were derived from mice 4-6 weeks of age and these also lacked an activated autoimmune phenotype. The line in each graph represents the cut-off used for normal values. The lower panel represents health scoring of these mice as described in the text of the Results. (B) 2 × 10⁵ syngeneic or allogeneic Treg cells were adoptively transferred into 1-2 day old neonatal C57BL/6 or BALB/c IL-2Rβ-/- mice. 10-16 weeks post-transfer, the recipient mice were evaluated for the immune parameters or hematocrit, as described in (A). Based on these values, health scores were assigned for each recipient in the lower panel.
Fig. 3
Fig. 3. TCR diversity of donor Treg cells from individual IL-2Rβ-/- mice adoptively transferred with syngeneic and allogeneic Treg cells
(A) The sensitivity of CDR3 spectratype analysis. Vβ or Vα spectratype analysis were performed with serial diluted CD4+ T cells from a C57BL/6 mouse. Total RNA was extracted from the indicated number of cells. One-twentieth of the cDNA was used for CDR3 spectratype analysis. D-scores were calculated and plotted against cell number. Supplemental Fig. 1 shows the spectratyping profiles that were used to calculate the D-scores. (B) Spectratype analysis of CD4+CD25+ Treg cells isolated from normal C57BL/6 (B6+/+) or the adoptively transferred IL-2Rβ-/- mice analyzed in Fig. 2B. Representative Vβ and Vα spectratype analysis for CDR3 for the indicated Vβ and Jβ1.1 gene segments or Vα subfamily and Cα gene segment for Treg cells isolated from individual mice. The D-score is shown to the right of each spectratype profile. (C) D-scores for Vβ and Vα spectratype distribution profiles for all mice (n=4 mice/group). Data for the averaged D-scores were compared by 1-way ANOVA.
Fig. 4
Fig. 4. TCRβ Tg+ Treg cells as a donor cells for adoptive transfer into neonatal C57BL/6 IL-2Rβ-/- mice
Treg cells were purified from the spleens of TCRβ Tg+ and Tg- mice and adoptively transferred into neonatal C57BL/6 IL-2Rβ-/- mice. Pre-transferred (A-D)Tg+ and Tg- Treg cells were enumerated before purification (A) and after purification (B). Expression of Vβ8.2 and Foxp3 was examined for the purified cells (B) contained within the upper right quadrant. (C) Inhibition of anti-CD3-induced proliferation of conventional CD4+ T cells by pre-transferred TCRβ Tg+ and Tg- Treg cells. (D) Expression of Ki67 and Bcl-2 by CD4+ Foxp3+ Treg cells prior to adoptive transfer. (E) Representative engraftment by donor TCR Tg+ and Tg- Treg cells 8 wks post-transfer from IL-2Rβ-/- recipients that received 2 × 10⁵ Treg cells. (F) LN cellularity, expression of CD69 by peripheral CD4+ T cells, Treg cells in the LN, and the hematocrit were assessed for individual IL-2Rβ-/- recipients at 8-18 wks post-transfer. The x-axis represents the Treg input dose and the time post-transfer the recipients were analyzed. The line in each graph is from Fig. 2A and represents the cut off for normal values. (G) Based on the values in (F) and histopathology, health scores were assigned for each recipient. Health scoring for recipient of Tg- donor Treg cells includes relevant mice from Fig. 2 and additional recipients. The numbers within the gated regions (A,B, E) or to the right of the dot plots (D) represent the percent positive cells.
Fig. 5
Fig. 5. Spectratype analysis for TCRα diversity of input and donor TCRβ Tg+ Treg cells from individual IL-2Rβ-/- recipient mice
At the indicated time post-transfer, TCRβ Tg+ Treg cells were purified from individual C57BL/6 IL-2Rβ-/- recipients. (A) Representative Vα spectratype analysis for CDR3 was performed for the indicated Vα subfamily and Cα gene segment for input and donor-derived Treg cells. Spectratype analysis for CDR3 size distribution of Vβ8.2 is shown to illustrate the expression of the TCRβ Tg by these populations of purified Treg cells. The D-score is shown to the right of each spectratype profile. (B) D-scores for Vα spectratype distribution profiles for all mice (n=4-6 mice/group). Data for the averaged D-scores were compared by 1-way ANOVA. (C) The averaged D-score for the recipients that received TCRβ Tg+ Treg cells were plotted against the health scores as assigned in Fig. 4F. Data were compared by unpaired one-tailed t-test.
Fig. 6
Fig. 6. Vα2 CDR3 sequence diversity and similarity from donor TCRβ Tg+ Treg cells pre- and post-transfer into IL-2Rβ-/- recipient mice
CDR3 sequences for Vα2 TCR subfamilies were determined for Treg cells for recipients analyzed in Fig. 4 and 5. The input pre-transferred Treg cells were typically pooled from 4-6 mice to acquire sufficient cells to inject all neonatal IL-2Rβ-/- mice from a litter. The indicated pre- and hence post-transferred TCRβ Tg+ Treg cells are on the TCRα+/- genetic background to minimize sequences from Treg cell that expressed two TCR α-chains. Treg cells from the other recipients are on the TCRα+/+ genetic background. (A) Sequence accumulation of pre- and post-transferred Treg cells where recipients from an individual litter are grouped. (B) The number of sequences within individual samples of pre-transferred Treg cells or isolated from individual recipients was calculated by ACE and compared by 1-way ANOVA. A similar ACE calculation was made after grouping together (pooled) the entire set of sequences from the same litter of recipients as these mice received the same pre-transferred Treg cell inoculum. The two pooled samples at post/100,000 represent individuals 1-4 and 5-6. (C) ACE values for the Treg cells from individual recipients were plotted against the health scores as assigned in Fig. 4F. Data for the ACE values were compared by unpaired one-tailed t-test. (D) The similarity of CDR3 sequences of the pre-transferred Treg cells was compared to all post-transferred cells by calculation of Morisita-Horn similarity values and represented by a heat map. Input sequences were compared to sequences from individual recipients or as pooled groups based on receiving the same donor inoculums.
Fig. 7
Fig. 7. Frequency of Vα2 CDR3 sequences associated with pre- and post-transferred TCRβ Tg+ Treg cells
(A) All unique sequences in the Vα2 data set expressed at a frequency ≥4% in any pre-transferred sample (input) or any individual recipient post-transferred (output) were identified. The prevalence of these sequences were compared to each other and represented as a heat map. (B) The frequency distribution of the two most prevalent sequences in the pre-transferred Treg cells in relationship to matched output post-transferred Treg cells. (C) Frequency of the 3 most prevalent sequences within individual samples of pre- and post-transferred Treg cells.

References

    1. Apostolou I, Sarukhan A, Klein L, von Boehmer H. Origin of regulatory T cells with known specificity for antigen. Nat. Immunol. 2002;3:756–763. - PubMed
    1. Jordan MS, Boesteanu A, Reed AJ, Petrone AL, Holenbeck AE, Lerman MA, Naji A, Caton AJ. Thymic selection of CD4+CD25+ regulatory T cells induced by an agonist self-peptide. Nat. Immunol. 2001;2:301–306. - PubMed
    1. Picca CC, Larkin J, 3rd, Boesteanu A, Lerman MA, Rankin AL, Caton AJ. Role of TCR specificity in CD4+ CD25+ regulatory T-cell selection. Immunol. Rev. 2006;212:74–85. - PubMed
    1. Hsieh CS, Liang Y, Tyznik AJ, Self SG, Liggitt D, Rudensky AY. Recognition of the peripheral self by naturally arising CD25+ CD4+ T cell receptors. Immunity. 2004;21:267–277. - PubMed
    1. Kawahata K, Misaki Y, Yamauchi M, Tsunekawa S, Setoguchi K, Miyazaki J, Yamamoto K. Generation of CD4+CD25+ regulatory T cells from autoreactive T cells simultaneously with their negative selection in the thymus and from nonautoreactive T cells by endogenous TCR expression. J. Immunol. 2002;168:4399–4405. - PubMed

Publication types

MeSH terms

Substances