. 2010 Jan 1;184(1):173-83.
doi: 10.4049/jimmunol.0902372. Epub 2009 Nov 30.

ATP-binding cassette transporter G1 negatively regulates thymocyte and peripheral lymphocyte proliferation

Affiliations

ATP-binding cassette transporter G1 negatively regulates thymocyte and peripheral lymphocyte proliferation

Allison J Armstrong et al. J Immunol. .

Abstract

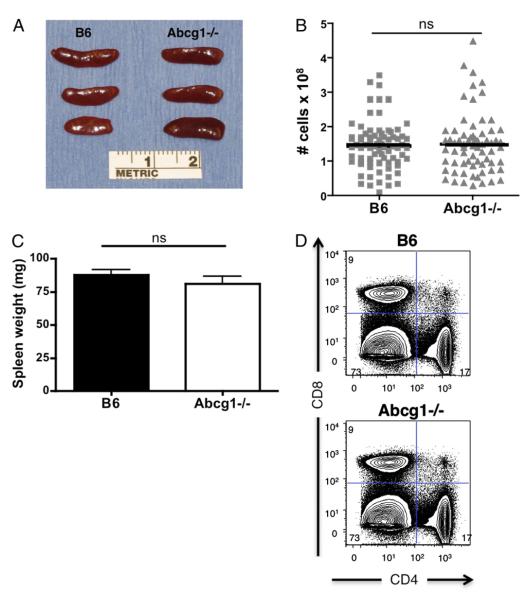
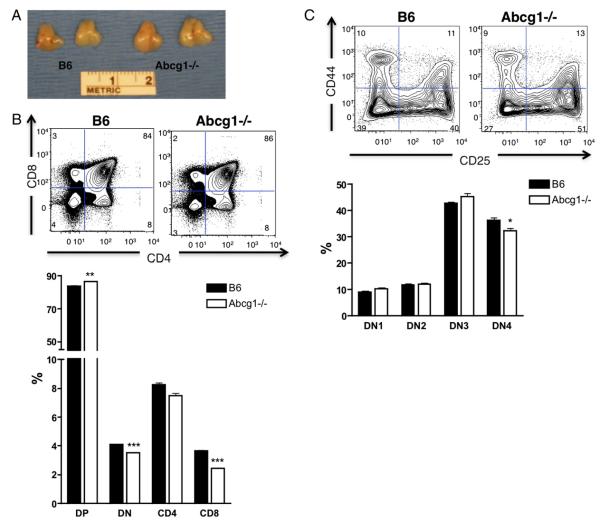
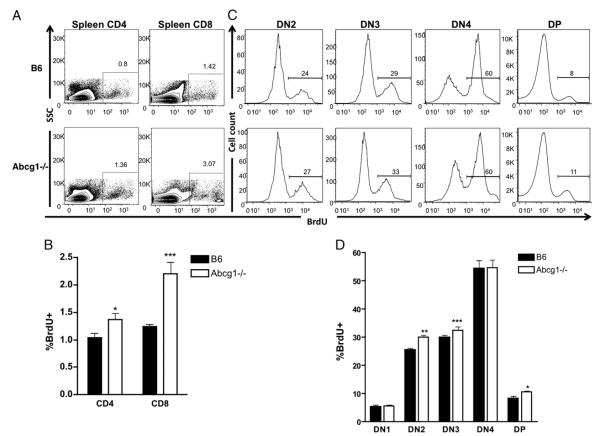
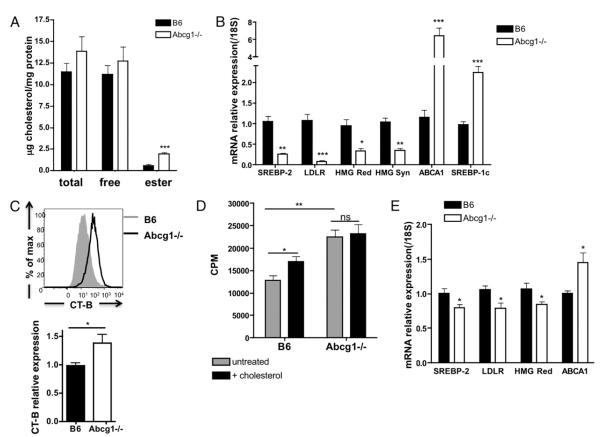
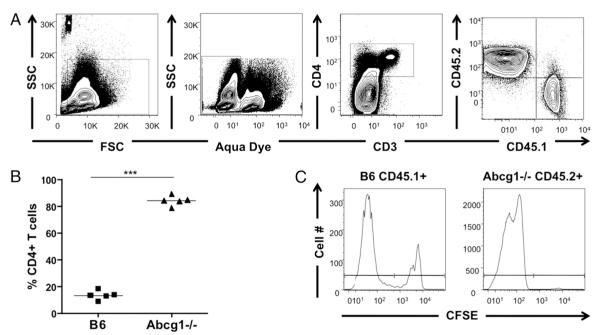
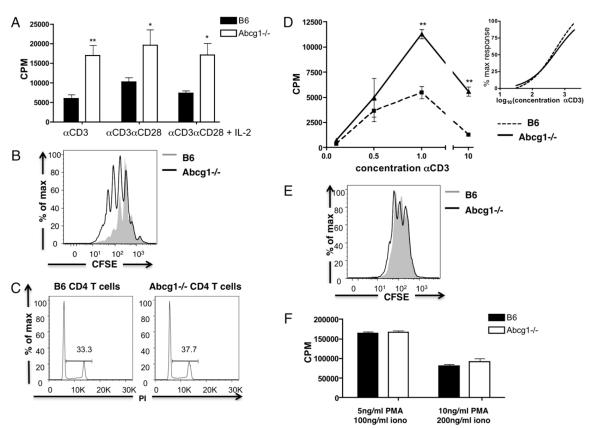
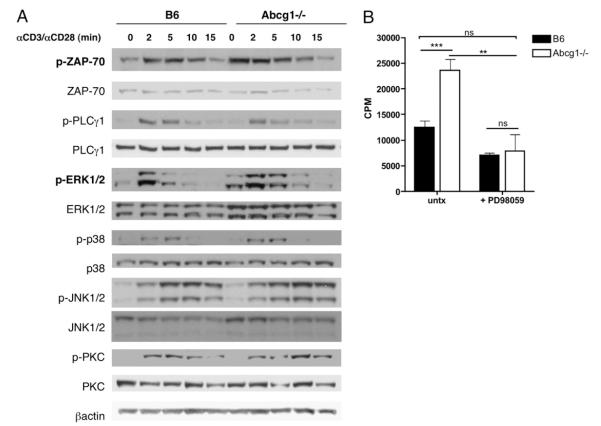
Cholesterol is a key component of cell membranes and is essential for cell growth and proliferation. How the accumulation of cellular cholesterol affects lymphocyte development and function is not well understood. We demonstrate that ATP-binding cassette transporter G1 (ABCG1) regulates cholesterol homeostasis in thymocytes and peripheral CD4 T cells. Our work is the first to describe a cell type in Abcg1-deficient mice with such a robust change in cholesterol content and the expression of cholesterol metabolism genes. Abcg1-deficient mice display increased thymocyte cellularity and enhanced proliferation of thymocytes and peripheral T lymphocytes in vivo. The absence of ABCG1 in CD4 T cells results in hyperproliferation in vitro, but only when cells are stimulated through the TCR. We hypothesize that cholesterol accumulation in Abcg1(-/-) T cells alters the plasma membrane structure, resulting in enhanced TCR signaling for proliferation. Supporting this idea, we demonstrate that B6 T cells pretreated with soluble cholesterol have a significant increase in proliferation. Cholesterol accumulation in Abcg1(-/-) CD4 T cells results in enhanced basal phosphorylation levels of ZAP70 and ERK1/2. Furthermore, inhibition of ERK phosphorylation in TCR-stimulated Abcg1(-/-) T cells rescues the hyperproliferative phenotype. We describe a novel mechanism by which cholesterol can alter signaling from the plasma membrane to affect downstream signaling pathways and proliferation. These results implicate ABCG1 as an important negative regulator of lymphocyte proliferation through the maintenance of cellular cholesterol homeostasis.


Figures

FIGURE 1
FIGURE 1
Abcg1−/− spleen and CD4/CD8 frequencies appear normal. A, Gross morphology of spleens from 6- to 8-wk-old mice. B, Graph of total spleen cellularity. C, Graph of spleen weight. D, Representative plots of frequency of CD4+ and CD8+ lymphocytes.
FIGURE 2
FIGURE 2
ABCG1 regulates thymocyte development. A, Gross morphology of thymus from 5-wk-old mice. B, Representative plots of frequency of CD4+CD8+ (DP), CD4CD8 (DN), CD4+CD8 (CD4 SP), and CD4CD8+ (CD8 SP) thymocytes and graph representation (n = 13). C, Representative plots of frequency of CD25 versus CD44 populations on lineage (CD4, CD8, CD3, CD19, Mac1, Gr1, Ter119, NK1.1)-negative DN thymocytes and graph representation (n = 12). *p < 0.05; **p < 0.01; ***p < 0.0001.
FIGURE 3
FIGURE 3
Abcg1−/− mice have increased thymocyte and peripheral lymphocyte proliferation in vivo. Five-week-old B6 (n = 8) and Abcg1−/− (n = 8) mice were injected with 1 mg of BrdU and sacrificed 4 h later. A, Representative plots SSC versus BrdU of CD4+CD3+ T cells and CD8+CD3+ T cells from the spleen. B, Graph of frequencies of CD4+ or CD8+ T cells that incorporated BrdU. C, Representative histograms of BrdU+ cells in lineage (CD4, CD8, CD3, CD19, Mac1, Gr1, Ter119, NK1.1)-negative DN thymocyte subsets DN2 (CD25+CD44+), DN3 (CD25+CD44−) DN4 (CD25−CD44−), and DP (CD4+CD8+) thymocytes and (D) graph of frequencies of cells in each thymocyte subset that incorporated BrdU. *p < 0.05; **p < 0.01; ***p < 0.0001.
FIGURE 4
FIGURE 4
Abcg1−/− CD4 T cells have increased cholesterol content. A, Total cholesterol and free cholesterol was measured in purified CD4 T cells by gas chromatography (n = 7). Cholesteryl ester was calculated as the difference between total and free cholesterol (multiplied by 1.67). B, SREBP-2 and LXR targets genes measured in naive CD4 T cells by real-time PCR (n = 6–10). C, Lipid rafts were measured in CD4 T cells by flow cytometry using fluorescently labeled CT-B (see Materials and Methods). A representative intensity plot of B6 and Abcg1−/− lipid raft staining. Graph represents relative expression to B6 mean fluorescence intensity of CT-B Alexa Fluor 488 (n = 15). D, Naive CD4 T cells were purified from B6 and Abcg1−/− mice (n = 4), incubated with 20 μg/ml soluble cholesterol for 2 h, and stimulated with αCD3αCD28 beads. 3H thymidine was added to cultures after a 48-h stimulation and harvested after 18 h. E, SREBP-2 and LXR target genes measured in thymocytes by real-time PCR (n = 6–10). *p < 0.05; **p < 0.01; ***p < 0.001.
FIGURE 5
FIGURE 5
Abcg1−/− CD4 T cells have a homeostatic proliferative advantage. B6 (CD45.1+) and Abcg1−/− (CD45.2+) naive CD4 T cells were purified from spleen, labeled with CFSE, and coinjected into RAG−/− mice. After 7 d, the spleen was harvested and stained for proliferating T cells. A, Cells were gated on forward light scatter versus SSC, aqua LIVE/DEAD negative, CD4+, and CD45.1+ or CD45.2+. B, Percentage of CD4 T cells that are B6 or Abcg1−/−. n = 5, repeated twice. ***p < 0.0001. C, CFSE dilution of CD45.1+ or CD45.2+ CD4 T cells.
FIGURE 6
FIGURE 6
Naive CD4 T cells from Abcg1−/− mice are hyperproliferative to TCR stimulation. Naive CD4 T cells were purified from spleen. A, Cells (n = 4) were stimulated with plate-bound αCD3 (1 μg/ml), soluble αCD28 (1 μg/ml), and IL-2 (10 U/ml). 3H thymidine was added to cultures after a 48-h stimulation and harvested after 18 h. B, CFSE-labeled cells (n = 4) were stimulated with 1 μg/ml plate-bound αCD3 and 1 μg/ml αCD28, and CFSE dilution was measured after 72 h. C, Cells (n = 3) were stimulated with 1 μg/ml plate-bound αCD3 and 1 μg/ml αCD28 and stained with propidium iodide after 48 h to determine the cell cycle. D, Cells (n = 4) were stimulated with 0.1–10 μg/ml plate-bound αCD3 and 1 μg/ml soluble αCD28, and 3H thymidine incorporation was measured. Graph represents 3H thymidine incorporation (inset). Nonlinear curve regression was used to fit the data to sigmoidal curves and calculate EC50. E, CFSE-labeled cells (n = 6) were stimulated with 5 ng/ml PMA and 100 ng/ml ionomycin, and CFSE dilution was measured after 72 h. F, Cells (n = 4) were stimulated with PMA and ionomycin (iono), and 3H thymidine incorporation was measured. *p < 0.05; **p < 0.01; ***p < 0.0001.
FIGURE 7
FIGURE 7
Enhanced ERK1/2 phosphorylation results in hyperproliferation of Abcg1−/− CD4 T cells. A, B6 and Abcg1−/− naive CD4 T cells were stimulated with cross-linked anti-CD3 and anti-CD28 mAbs for the indicated times. Cell lysates were separated by SDS-PAGE and immunoblotted with the indicated Abs. Each blot was repeated twice. B, B6 and Abcg1−/− naive CD4 T cells (n = 4) were stimulated with plate-bound αCD3 (1 μg/ml) and soluble αCD28 (1 μg/ml) in the presence or absence (untx) of 10 μM PD98059. 3H thymidine was added to cultures after a 48-h stimulation and harvested after 18 h. **p < 0.01; ***p < 0.001.

Similar articles

Cited by

References

    1. Cantrell DA. Transgenic analysis of thymocyte signal transduction. Nat. Rev. Immunol. 2002;2:20–27. - PubMed
    1. Rothenberg EV, Moore JE, Yui MA. Launching the T-cell-lineage developmental programme. Nat. Rev. Immunol. 2008;8:9–21. - PMC - PubMed
    1. Michie AM, Zúñiga-Pflücker JC. Regulation of thymocyte differentiation: pre-TCR signals and β-selection. Semin. Immunol. 2002;14:311–323. - PubMed
    1. Goldrath AW, Bevan MJ. Selecting and maintaining a diverse T-cell repertoire. Nature. 1999;402:255–262. - PubMed
    1. Freitas AA, Rocha B. Peripheral T cell survival. Curr. Opin. Immunol. 1999;11:152–156. - PubMed

Publication types

MeSH terms

Substances