. 2010 Jan 1;184(1):154-63.
doi: 10.4049/jimmunol.0800167. Epub 2009 Nov 30.

Differentiation stage-specific requirement in hypoxia-inducible factor-1alpha-regulated glycolytic pathway during murine B cell development in bone marrow

Affiliations

Differentiation stage-specific requirement in hypoxia-inducible factor-1alpha-regulated glycolytic pathway during murine B cell development in bone marrow

Hidefumi Kojima et al. J Immunol. .

Abstract

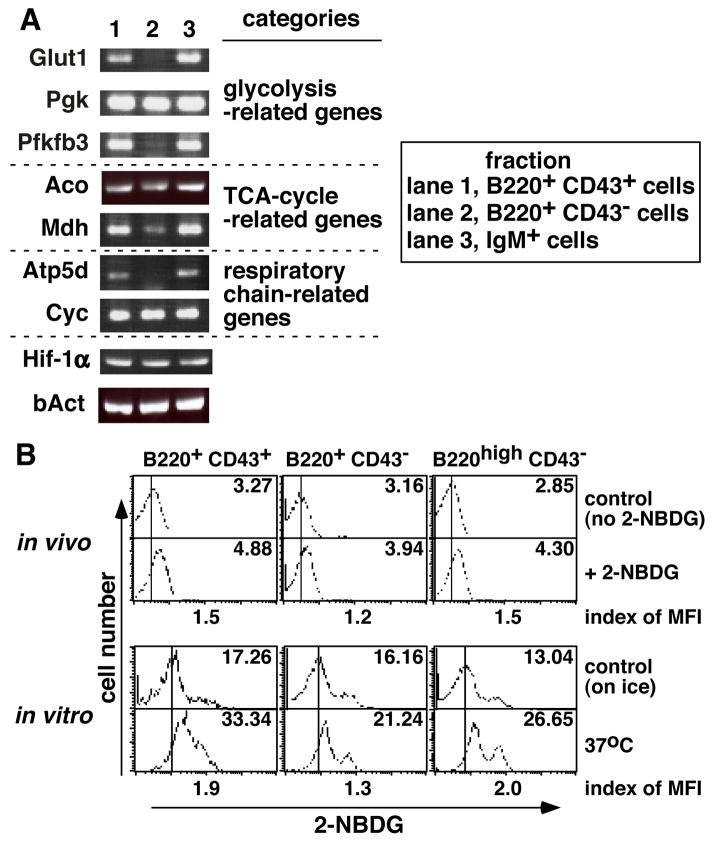
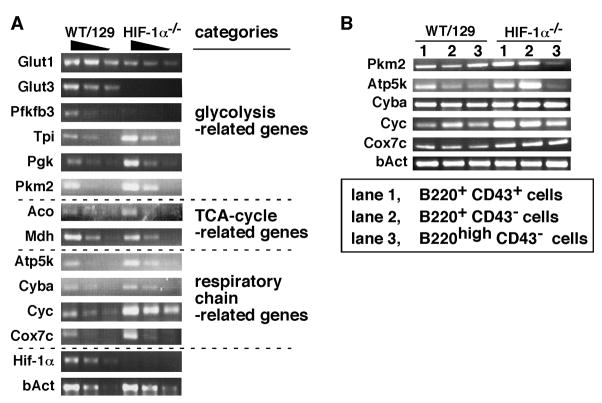
Hypoxia-inducible factor (HIF)-1alpha plays a central role in oxygen homeostasis and energy supply by glycolysis in many cell types. We previously reported that an HIF-1alpha gene deficiency caused abnormal B cell development and autoimmunity. In this study we show that HIF-1alpha-enabled glycolysis during B cell development is required in a developmental stage-specific manner. Supporting this conclusion are observations that the glycolytic pathway in HIF-1alpha-deficient B220(+) bone marrow cells is much less functionally effective than in wild-type control cells. The expression of genes encoding the glucose transporters and the key glycolytic enzyme, 6-phosphofructo-2-kinase/fructose-2,6-bishosphatase 3, was greatly reduced in HIF-1alpha-deficient cells. The compensatory adaptation to the defect of glycolysis was reflected in higher levels of expression of respiratory chain-related genes and TCA cycle-related genes in HIF-1alpha-deficient cells than in wild-type cells. In agreement with these findings, HIF-1alpha-deficient cells used pyruvate more efficiently than wild-type cells. The key role of HIF-1alpha-enabled glycolysis in bone marrow B cells was also demonstrated by glucose deprivation during in vitro bone marrow cell culture and by using a glycolysis inhibitor in the bone marrow cell culture. Taken together, these findings indicate that glucose dependency differs at different B cell developmental stages and that HIF-1alpha plays an important role in B cell development.


Conflict of interest statement

Disclosures

The authors have no financial conflict of interest.

Figures

FIGURE 1
FIGURE 1
B220+ CD43 IgM pre-B cells are more resistant to glycolysis inhibitior 2-deoxy-D-glucose (2-DOG) than other fractions during B cell development. (A) Bone marrow cells from wild-type C57BL/6 mice were cultured with irradiated ST-2 cells in the presence or absence of 2-DOG. The 2-DOG concentrations are indicated. Two days later, expression levels of B220 and CD43 were examined. Dead cells were excluded by PI staining. (B) Expression patterns of BP-1 vs. CD24 (left panels), and CD19 (right panels) on B220+ CD43+ cells from culture indicated in (A) were depicted. Depicted figures were from cultures in the absence or presence of 2-DOG (at a final concentration of 0.6 mM) for two days. (C) B220+ CD43+ cells, B220+ CD43 IgM cells, and B220+ CD43 IgM+ cells were prepared from bone marrow of C57BL/6 mice by using a FACS Aria system. These cells were cultured with irradiated ST-2 cells in the absence or presence of 2-DOG (2.5mM). After indicated days of culture, cells were harvested and B220/CD43 or IgM/B220 expression levels were assessed. Purities of inputted B220+ CD43+ cells, B220+ CD43 IgM cells, and B220+ CD43 IgM+ cells were depicted in each panel. d0, d1, d2 and d6 stand for day 0, day 1, day 2, and day 6, respectively. Proportions of cells in designated areas are indicated. (D) B220+ CD43+ cells, B220+ CD43 IgM cells, and IgM+ cells from C57BL/6 bone marrow were cultured with irradiated ST-2 in the presence of 2DOG (0.5mM, 1mM). Two days later, cells were harvested and the numbers of live cells were calculated. Depicted panels illustrated index of live cell numbers.
FIGURE 2
FIGURE 2
The glycolytic pathway plays a critical role in cell-survival, but not in cell-proliferation of bone marrow B cells. Bone marrow cells from wild-type C57BL/6 mice were cultured with irradiated ST-2 cells in the presence or absence of 2-DOG (1.25mM) with glucose (2 g/l). The bone marrow cell culture was also performed under without glucose conditions. The cultures were supplemented with rmIL-7 at a final concentration of 10 ng/ml. (A) Two days later, dead cells in the B220+ cell fraction of the cultures were assessed by PI and annexin V staining. (B) CFSE labeled-cells were cultured. Five days later, B220+ cell proliferation was assessed. Forward scatter (FSC) vs. side scatter (SSC) gating designs for each experiment were depicted. FSC/SSC profiles depicted in (A) and (B) were from 2-DOG containing- and 2-DOG free-culture, respectively.
FIGURE 3
FIGURE 3
Sufficiently high levels of extracellular glucose are essential for bone marrow B cells. Bone marrow cells from C57BL/6 mice were cultured with irradiated ST-2 cells in the presence of rmIL-7 at a final concentration of 10 ng/ml. Glucose-free medium was used for the cultures. As indicated in each panel, various concentrations of glucose were added to the cultures. Eight days after the culture, cells were harvested and analyzed. (A) CD43 and B220 expression levels were determined by flow cytometric analysis. Day 0 indicates phenotype of cells prior to the culture. Proportions of cells in designated areas are indicated. (B) The numbers of B220+ cells in each culture were calculated and were shown in index of cell number (cell number from glucose-free culture as one). Inserted panel magnified the results of low dose (0 -1 g/l) glucose cultures. The data shown represent one of three experiments.
FIGURE 4
FIGURE 4
Stage-specific expression of energy supply-related genes during B cell development. (A) B220+ CD43+ cells, B220+ CD43 IgM cells, and IgM+ cells were prepared from bone marrow of C57BL/6 mice. Expression levels of energy supply-related genes in these cells were determined by RT-PCR. Depicted lane 1, 2, and 3 indicate samples from B220+ CD43+ cells, B220+ CD43 IgM cells, and IgM+ cells, respectively. Purities of used B220+ CD43+ cells, B220+ CD43 IgM cells, and B220+ CD43 IgM+ cells were 85%, 90%, and 88% respectively. Abbreviations used: Glut1, glucose transporter type 1; Pgk1, phosphoglycerate kinase 1; Pfkfb3, 6-phosphofructo-2-kinase/fructose-2,6-bishosphatase 3; Aco, aconitase; Mdh, malate dehydorogenase; Atp5d, ATP synthase, H+ transporting, mitochondorial F1 complex, delta subunit; Cyc, cytochrome c; bAct, beta-actin. The data shown represented one of two or three individual samples. (B) Glucose uptake of bone marrow B cells was measured by using 2-NBDG. As a control sample for in vivo experiments, bone marrow cells from no 2-NBDG received mice were analyzed. (upper panels) To analyze glucose uptake in vitro, bone marrow cell suspension with 2-NBDG were incubated on ice (as control) or at 37°C for 30min. (lower panels). 2-NBDG fluorescence intensities among B220+ CD43+, B220+ CD43, and B220high CD43 fractions were illustrated. Mean fluorescence intensity (MFI) of 2-NBDG in each fraction and index of MFI (experimental sample/control sample) were indicated. The data shown represent one of four (in vivo) or five (in vitro) experiments.
FIGURE 5
FIGURE 5
HIF-1α deficient bone marrow B220+ cells are less susceptible to glucose deprivation than wild-type cells. Mixture of bone marrow cells from C57BL/6 mice and from Hif1a−/− ES cells →Rag2−/− chimeric mice were cultured with irradiated ST-2 cells in the presence of rmIL-7 at a final concentration of 10 ng/ml. Glucose-free medium was used for the cultures. As indicated in each panel, various concentrations of glucose were added to the cultures. After 7 days of culture, cells were harvested and analyzed. (A) Ly-9.1 expression patterns among B220+ cells were illustrated. Ly-9.1+ and Ly-9.1 cells were Hif1a−/− ES cell origin and Hif1a+/+ C57BL/6 mice origin, respectively. Day 0 indicates those of prior to the culture. (B) The ratios of Hif1a−/−/Hif1a+/+ B220+ cell numbers were calculated and were depicted. The data shown represent one of five experiments.
FIGURE 6
FIGURE 6
HIF-1α deficient bone marrow cells are more resistant to 2-DOG than wild-type bone marrow cells. Bone marrow cells were prepared from Hif1a−/− ES cells →Hif1a+/+ C57BL/6 chimera mice. The cells were cultured in the presence or absence of indicated concentrations of 2-DOG. Two days later, cells were harvested. (A) Ly-9.1 expression patterns among B220+ cells were analyzed. Ly-9.1+ and Ly-9.1 cells were Hif1a−/− ES cell origin and Hif1a+/+ C57BL/6 blastocyst origin, respectively. (B) The ratios of Hif1a−/−/Hif1a+/+ (WT) B220+ cell numbers were calculated and were depicted. The data shown represent one of three experiments.
FIGURE 7
FIGURE 7
Expression of energy supply-related genes in HIF-1α−/− B220+ bone marrow cells. (A) Ly-9.1+ B220+ bone marrow cells were purified from wild-type 129 mice and Hif1a−/− ES cells →Rag2−/− chimeric mice. Total RNA samples were purified from these cells and were used for RT-PCR to determine expression levels of energy supply-related genes. Purities of cells from HIF-1α deficient chimeric mice and from wild-type mice were 82% and 94%, respectively. (B) Ly-9.1+ B220+ bone marrow cells from those mice were further fractionated into three fractions, which are indicated in the figure. Expression levels of energy supply-related genes in each fraction were analyzed. Purities of B220+ CD43+ cells, B220+ CD43 cells, and B220high CD43 cells from wild-type mice were 84%, 97%, and 97% respectively. Purities of B220+ CD43+ cells, B220+ CD43 cells, and B220high CD43 cells from HIF-1α deficient chimeric mice were 84%, 88%, and 98% respectively. Abbreviations used: Glut3, glucose transporter 3; Tpi, triosephosphate isomerase; Pkm2, M2-type pyruvate kinase; Atp5k, ATP synthase, H+ transporting, mitochondrial F1F0 complex, subunit e; Cyba, cytochrome b-245, alpha polypeptide; Cox7c, cytochrome c oxidase, subunit VIIc. Other abbreviations were similarly used in Figure 4. The data shown represented one of two or three individual samples.
FIGURE 8
FIGURE 8
HIF-1α deficient bone marrow cells are more susceptible to effects of pyruvate addition than wild type bone marrow cells. (A) Bone marrow cells from C57BL/6 mouse were cultured with irradiated ST-2 stromal cells in the presence (2 g/l) or absence of glucose. The cultures were further supplied with IL-7 at a final concentration of 10 ng/ml. Sodium pyruvate was added to cultures at a final concentration of 1 mM or 5 mM. After 7 days of culture, CD43 and B220 expression levels were analyzed. Proportions of cells in the designated areas are indicated. (B) Bone marrow cells from Hif1a−/− ES cells →Hif1a+/+ C57BL/6 chimeric mouse were similarly cultured in panel A. Indicated final concentrations of sodium pyruvate was added to cultures. After 7 days of culture, proportions of Ly-9.1+ cells among B220+ cells were analyzed. Ly-9.1+ cells and Ly-9.1 cells were of Hif1a−/− ES cell origin and B6 blastocyst origin, respectively. (C) The numbers of Hif1a−/− and Hif1a+/+ B220+ cells were calculated and were expressed in index (cell number from glucose-supplied culture as one). The data shown represented one of three experiments.
FIGURE 9
FIGURE 9
Possible role of HIF-1α in regulation of glycolysis in B cell development. HIF-1α is critical for expression of glucose transporters (Glut1 and 3) and glycolytic enzyme(s) (PFKFB-3) during B cell development in bone marrow. The transition from late pro-B cells to pre-B cells, but not from pre-B cells to immature B cells, is dependent on the glycolytic pathway. Thus, HIF-1α is one of essential factors for B cell development in bone marrow.

References

    1. Caldwell CC, Kojima H, Lukashev D, Armstrong J, Farber M, Apasov SG, Sitkovsky MV. Differential effects of physiologically relevant hypoxic conditions on T lymphocyte development and effector functions. J Immunol. 2001;167:6140–6149. - PubMed
    1. Huang JH, Cardenas-Navia LI, Caldwell CC, Plumb TJ, Radu CG, Rocha PN, Wilder T, Bromberg JS, Cronstein BN, Sitkovsky M, Dewhirst MW, Dustin ML. Requirements for T lymphocyte migration in explanted lymph nodes. J Immunol. 2007;178:7747–7755. - PubMed
    1. Asosingh K, De Raeve H, de Ridder M, Storme GA, Willems A, Van Riet I, Van Camp B, Vanderkerken K. Role of the hypoxic bone marrow microenvironment in 5T2MM murine myeloma tumor progression. Haematology. 2005;90:810–817. - PubMed
    1. Iyer NV, Kotch LE, Agani F, Leung SW, Laughner E, Wenger RH, Gassmann M, Gearhart JD, Lawler AM, Yu AY, Semenza GL. Cellular and developmental control of O2 homeostasis by hypoxia-inducible factor 1α. Genes Dev. 1998;12:149–162. - PMC - PubMed
    1. Semenza GL. Regulation of mammalian O2 homeostasis by hypoxia-inducible factor 1. Annu Rev Cell Dev Biol. 1999;15:551–578. - PubMed

Publication types

MeSH terms

Substances