. 2010 Jan 1;184(1):94-104.
doi: 10.4049/jimmunol.0900753. Epub 2009 Nov 30.

CD4(+)CD25(+) regulatory T cells resist a novel form of CD28- and Fas-dependent p53-induced T cell apoptosis

Affiliations

CD4(+)CD25(+) regulatory T cells resist a novel form of CD28- and Fas-dependent p53-induced T cell apoptosis

Nagendra Singh et al. J Immunol. .

Abstract

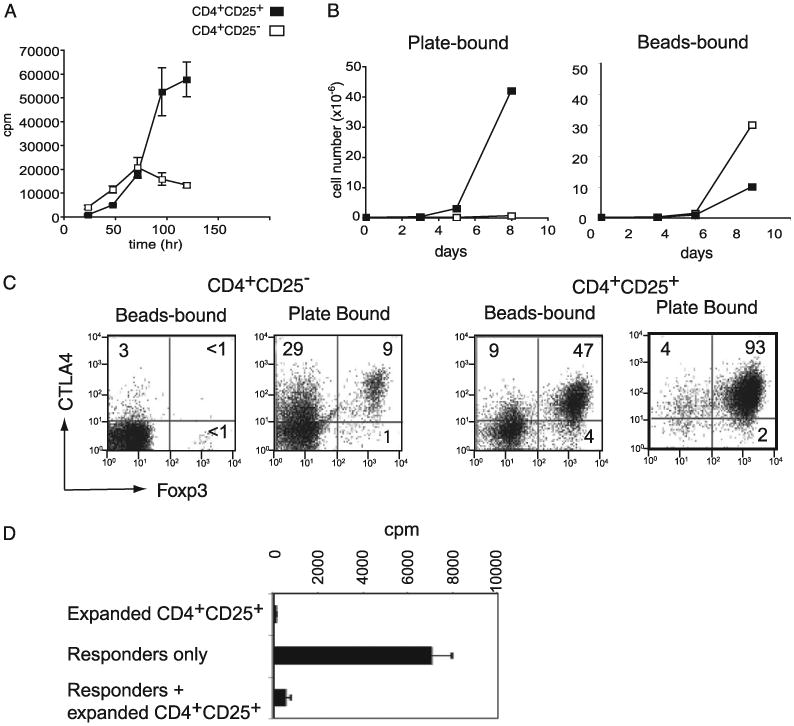
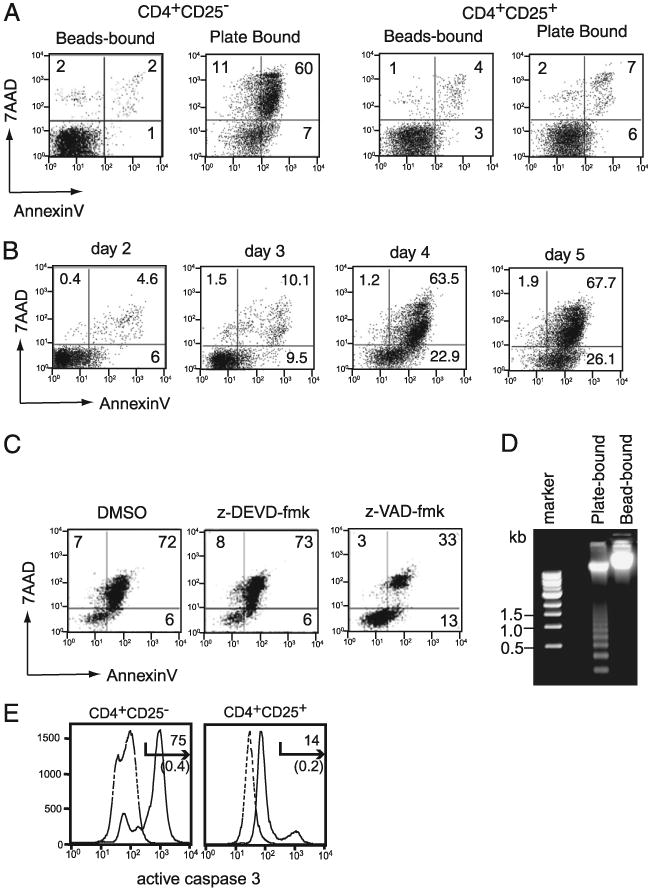
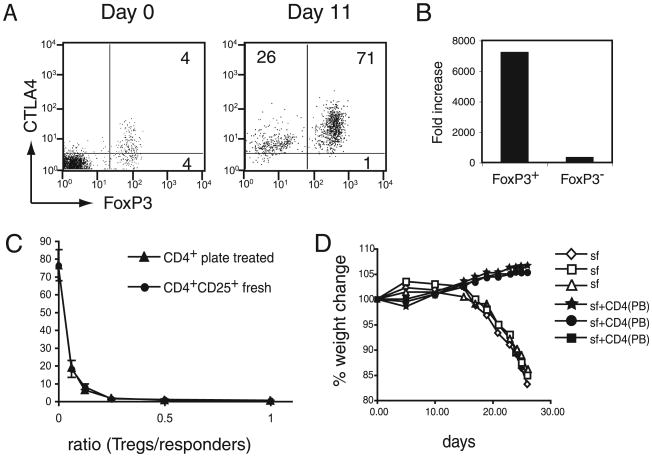
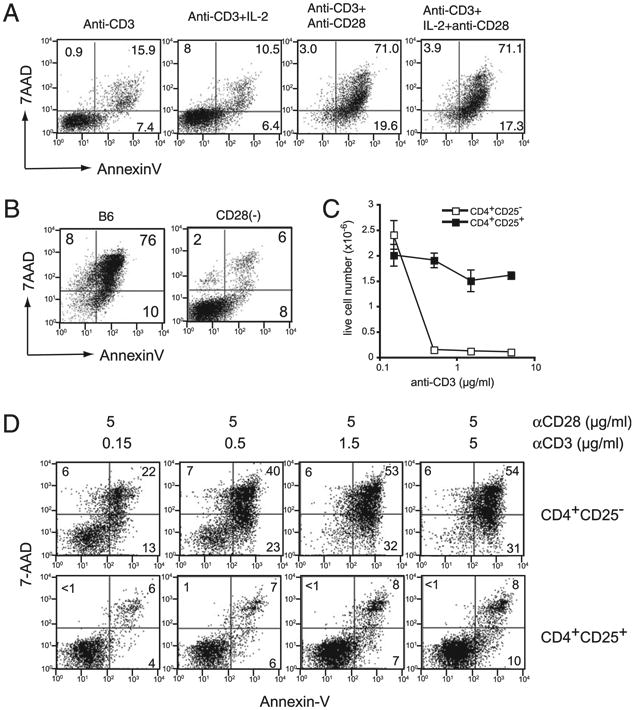
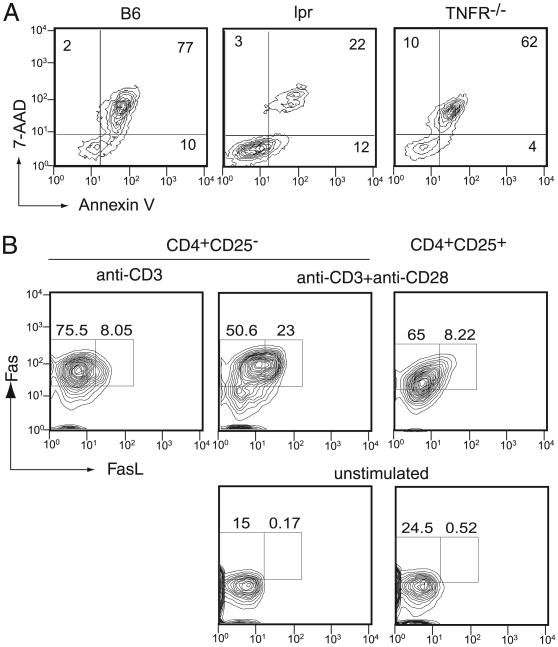
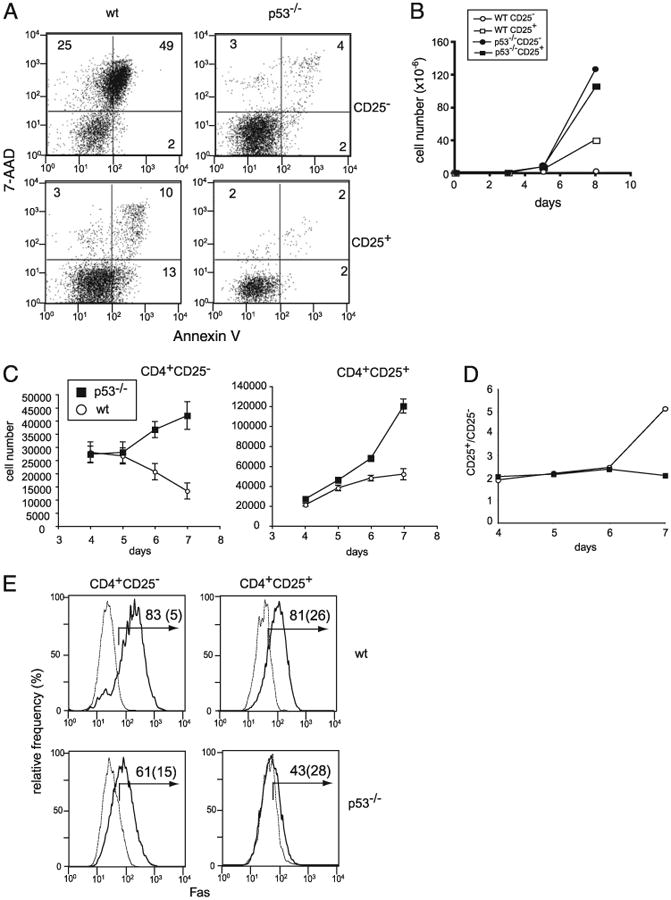
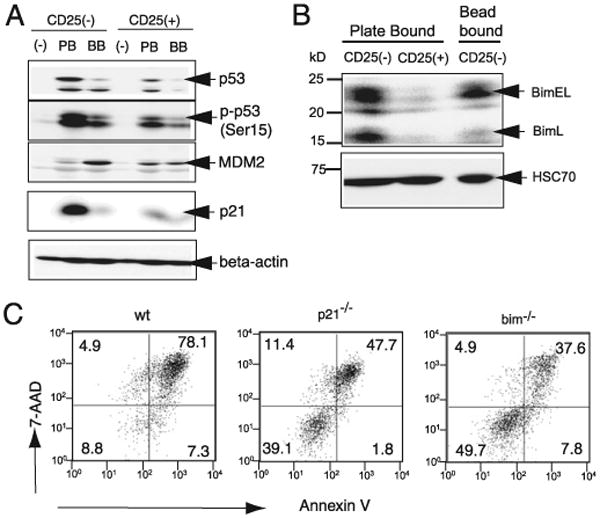
Ag receptor stimulation of preactivated T cells causes rapid cell death in an IL-2- and Fas-dependent manner. This phenomenon, known as activation-induced cell death (AICD), plays a pivotal role in the removal of Ag-reactive T cells after initial expansion. In this study, we report a novel form of T cell apoptosis that is distinct from classic AICD. When peripheral T cells were activated with anti-CD3 and anti-CD28 Abs precoated onto plastic plates, CD4(+)CD25(-) and CD8 T cells initially expanded but underwent massive apoptosis after 4 d. Unlike classic AICD, this type of T cell apoptosis pathway requires engagement of CD28 and expression of p53, a tumor-suppressor gene. The most striking feature of this form of apoptosis was regulatory T cell resistance. Under the same stimulating conditions, CD4(+)CD25(+) T cells grew continuously beyond 4 d. Consequently, when the entire CD4 population was cultured with plate-bound anti-CD3 plus anti-CD28 Ab, CD4(+)CD25(+)FoxP3(+) regulatory T cells outgrew nonregulatory T cells and expanded >7000-fold after 11 d. The data presented herein demonstrate a novel process of Ag-induced T cell death by sustained TCR and CD28 engagement and represent a simple and efficient procedure for the expansion of regulatory T cells in vitro.


Figures

Figure 1
Figure 1
Plate-bound anti-CD3 stimulation of CD4 T cells induces selective expansion of Tregs. A, T cell proliferation stimulated by plate-bound Abs. CD4+CD25+ and CD4+CD25 T cells were stimulated with plate-bound anti-CD3 and anti-CD28 Abs. The proliferation of each sample was measured by incorporation of 3H-thymidine uptake for 12 h after the point indicated on the x-axis. B, Expansion of CD4+CD25 and CD4+CD25+ T cells stimulated with anti-CD3 and anti-CD28 Abs precoated onto polystyrene beads or polystyrene plates. The number of live cells was counted at the indicated points by trypan blue exclusion. C, FoxP3 and CTLA4 expression by T cells expanded by anti-CD3 and anti-CD28 stimulation. CD4+CD25 and CD4+CD25+ T cells were stimulated with bead-bound or plate-bound anti-CD3 and anti-CD28 Abs. The cells were harvested after 8 d of stimulation and stained for FoxP3 and CTLA4. The numbers represent the percentage of positive cells in the corresponding quadrant. D, Anergy and suppressive functions of CD4+ CD25+ T cells expanded by plate-bound Abs. Primary CD4+CD25 T cells (responder only) or plate-bound expanded CD4+CD25+ T cells (expanded CD4+ CD25+) were stimulated with anti-CD3 Ab plus APCs separately or together (responder + expanded CD4+CD25+). Cell proliferation was measured by 3H-thymidine uptake 72 h after the start of stimulation.
Figure 2
Figure 2
Plate-bound Ab stimulation causes apoptotic cell death in CD4+CD25 cells. A, CD4+ CD25 and CD4+CD25+ T cells were stimulated with bead-bound or plate-bound anti-CD3 plus anti-CD28 Abs for 5 d and analyzed for Annexin V and 7-AAD staining. The percentage of positive cells in each quadrant is indicated. B, CD4+CD25 T cells were stimulated with plate-bound anti-CD3 and anti-CD28 Abs in the presence of IL-2 (10 ng/ml). Cells were harvested at indicated time points and cultured on a new plate devoid of any anti-CD3 or anti-CD28 Abs. On day 5, all of the cells were analyzed for cell death by Annexin V and 7-AAD staining. The numbers represent the percentage of positive cells in the corresponding quadrant. C, Effect of the pan-caspase inhibitor (Z-VAD-fmk) and caspase 3-specific inhibitor (Z-DEVD-fmk) on cell death. CD4+CD25 T cells were stimulated with plate-bound anti-CD3 and anti-CD28 Abs. After 2 d, the indicated cultures were supplemented with DMSO, z-VAD-fmk, or no treatment (control). Cell death was determined by Annexin V and 7-AAD staining on day 4. D, DNA ladder analysis of CD4+ CD25 T cells stimulated for 5 d with plate-bound or bead-bound anti-CD3 plus anti-CD28 Abs. Total DNA extracted from CD4+CD25 T cells stimulated with plate-bound or bead-bound Abs were subjected to electrophoresis. The size of the marker DNA is indicated in the left lane. E, CD4+CD25 T cells were stimulated with plate-bound anti-CD3 and anti-CD28 Abs, as in A. After 4 d of stimulation, cells were analyzed for activation of caspase 3 by staining with CaspGLOW staining reagent. Solid lines represent data from stimulated cells, and dotted lines show the data for unstimulated cells. The numbers above the arrow represent the percentage of positive cells from stimulated samples, and the numbers in parentheses show the percentage of positive cells from unstimulated samples.
Figure 3
Figure 3
Enrichment and expansion of functional nTregs from total CD4 cells by plate-bound Abs. A, Enrichment of Tregs by plate-bound stimulation of CD4 T cells. Total CD4 cells were stimulated with plate-bound anti-CD3 and anti-CD28 Abs for 11 d. Initial and expanded cells were analyzed for FoxP3 and CTLA4 expression. Numbers represent the percentage of positive cells in the corresponding quadrant. B, Fold increase in FoxP3+ and FoxP3 cells stimulated with plate-bound Abs. Cell numbers obtained for FoxP3+ and FoxP3 cells in the experiments shown in A were calculated and compared with the cell numbers of the initial population. C, In vitro suppression of T cell proliferation by freshly isolated nTregs or nTregs expanded by plate-bound Abs. A graded number of plate-bound expanded CD4+CD25+ (CD4+ plate-treated) and freshly sorted CD4+CD25+ T cells (CD4+CD25+ fresh) were tested for their ability to suppress anti-CD3–induced proliferation of CD4+CD25 T cells (2.5 × 10⁴cells/well). Proliferation was measured by incorporation of 3H-thymidine after 3d of culture. D, Suppression of wasting diseases inRag1−/− mice by plate-bound expanded CD4+T cells. Rag1−/− mice were injected i.v. with 106 scurfy mouse CD4T cells (sf) with or without an equal number of plate-bound expanded CD4+ T cells [CD4(PB)]. At different time points after injection, the mice were analyzed for weight loss. Each line represents an individual mouse.
Figure 4
Figure 4
CD28 stimulation is required for CD4+ CD25 T cell apoptosis. A, The role of CD28 and IL-2 in cell death. CD4+CD25 T cells were stimulated with plate-bound anti-CD3 Ab alone; anti-CD3 Ab plus IL-2; anti-CD3 plus anti-CD28 Abs; or anti-CD3 Ab, anti-CD28 Ab, and IL-2 for 5 d and analyzed for Annexin V and 7-AAD staining. B, Plate-bound stimulation of CD28−/− mouse T cells. CD4+CD25 T cells from B6 or CD28−/− mice were stimulated with plate-bound anti-CD3 and anti-CD28 Abs plus IL-2 and analyzed 5 d later for Annexin V and 7-AAD staining. C and D, Effect of the anti-CD3 Ab concentration on cell death. CD4+CD25 and CD4+ CD25+ T cells from B6 mice were stimulated for 5 d with graded doses (coated on the plastic plates at concentrations of 0.15–5 μg/ml) of the anti-CD3 Ab, along with anti-CD28 Ab (5 μg/ml) and IL-2. Live cell number (C) and cell-staining data for Annexin V and 7-AAD (D) are shown.
Figure 5
Figure 5
Fas is required for plate-bound Ab-induced apoptosis. A, CD4+CD25 T cells from C57.BL/6 (B6), Fas-deficient (lpr), or TNF-R–deficient (TNFR−/−) mice were stimulated with plate-bound anti-CD3 and anti-CD28 Abs. After 5 d, the cells were harvested and stained for Annexin V and 7-AAD, followed by analysis using a flow cytometer. B, CD4+CD25+ or CD4+ CD25 T cells from B6 mice were stimulated with plate-bound anti-CD3 Ab or anti-CD3 and anti-CD28 Abs for 3 d. At the end of the culture period, the cells were harvested and analyzed for Fas and FasL expression by flow cytometry. The percentage of cells in each rectangle is shown.
Figure 6
Figure 6
Apoptosis caused by plate-bound Abs is dependent on p53. A, CD4+CD25 (upper panels) and CD4+CD25 (lower panels) T cells from WT (left panels) and p53−/− C57.BL/6 (right panels) mice were stimulated with plate-bound anti-CD3 and anti-CD28 Abs for 5 d and analyzed for cell death by Annexin V and 7-AAD staining. B, Total number of live cells recovered on indicated days after stimulation of CD4+CD25 (circles) and CD4+ CD25+ (squares) T cells from WT B6 (open symbols) and p53−/− (filled symbols) mice. C, Allogenic DCs cause p53-dependent T cell death. Sorted CD4+CD25 and CD4+ CD25+ T cells from B6 and p53−/− (B6 background) mice were stimulated with sorted CD11c+ cells from BALB/c mice (2.5 × 10³ T cells/well and 4 × 10³ DCs per well in U-bot-tom 96-well plates in the presence of IL-2). At the indicated time points, cells were harvested, and viable cells were analyzed by analysis of trypan blue exclusion and FoxP3 expression. D, The live cell numbers of FoxP3 and FoxP3+ T cells in CD4+CD25+ cultures. The number of FoxP3+ cells was calculated based on total live cells and the percentage of FoxP3+ T cells present in the culture. At the start of the culture, WT and p53−/− CD4+CD25+ T cell populations contained 92% and 91% FoxP3+ cells, respectively. E, Fas expression by CD4+CD25 cells and CD4+CD25+ cells from WT C57.BL/6 (upper panels) and p53−/− mice (lower panels). Fas expression by un-stimulated cells (dotted lines) and cells stimulated with plate-bound anti-CD3 plus anti-CD28 Abs (solid lines) are shown. Numbers represent the percentage of Fas-positive cells for stimulated and unstimulated (parenthesized) cells.
Figure 7
Figure 7
MDM2, p21, and Bim are differentially regulated between plate-bound Ab-stimulated CD4+CD25 and CD4+CD25+ T cells. A, Expression of p53, MDM2b, and p21 by CD4+CD25 and CD4+CD25+ T cells after plate-bound or bead-bound anti-CD3 and anti-CD28 Ab stimulation. After 3 d of activation, total cell lysate from the indicated cells was prepared and subjected to SDS-PAGE (0.75 × 10⁶ cells/lane), followed by Western blotting and immunodetection of the indicated molecules. The specificity of the p53 band was confirmed by Western blotting of lysates from p53−/− T cells (data not shown). B, The indicated cells types were stimulated with plate- or bead-bound Abs; after 3 d, total cell lysate was analyzed for Bim by Western blotting, as in A. The lower panel shows the expression of the constitutively expressed protein HSC70. C, CD4+CD25 T cells from WT, p21−/−, and Bim−/− mice were stimulated by plate-bound anti-CD3 and anti-CD28 Abs for 5 d and analyzed for Annexin V and 7-AAD staining.

Similar articles

Cited by

References

    1. Belkaid Y. Role of Foxp3-positive regulatory T cells during infection. Eur J Immunol. 2008;38:918–921. - PMC - PubMed
    1. Sakaguchi S, Yamaguchi T, Nomura T, Ono M. Regulatory T cells and immune tolerance. Cell. 2008;133:775–787. - PubMed
    1. Read S, Malmström V, Powrie F. Cytotoxic T lymphocyte-associated antigen 4 plays an essential role in the function of CD25(+)CD4(+) regulatory cells that control intestinal inflammation. J Exp Med. 2000;192:295–302. - PMC - PubMed
    1. Collison LW, Workman CJ, Kuo TT, Boyd K, Wang Y, Vignali KM, Cross R, Sehy D, Blumberg RS, Vignali DA. The inhibitory cytokine IL-35 contributes to regulatory T-cell function. Nature. 2007;450:566–569. - PubMed
    1. Pandiyan P, Zheng L, Ishihara S, Reed J, Lenardo MJ. CD4+ CD25+Foxp3+ regulatory T cells induce cytokine deprivation-mediated apoptosis of effector CD4+ T cells. Nat Immunol. 2007;8:1353–1362. - PubMed

Publication types

MeSH terms