. 2010 Jan-Mar;4(1):46-55.
doi: 10.4161/cam.4.1.9953. Epub 2010 Jan 31.

Quimp3, an automated pseudopod-tracking algorithm

Affiliations

Quimp3, an automated pseudopod-tracking algorithm

Leonard Bosgraaf et al. Cell Adh Migr. 2010 Jan-Mar.

Abstract

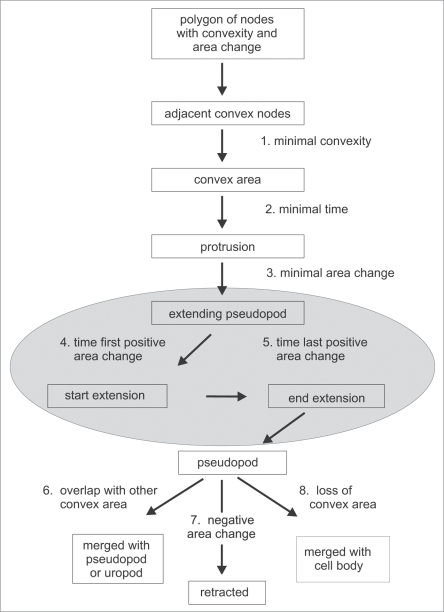
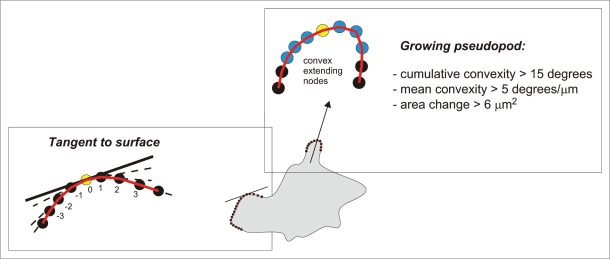
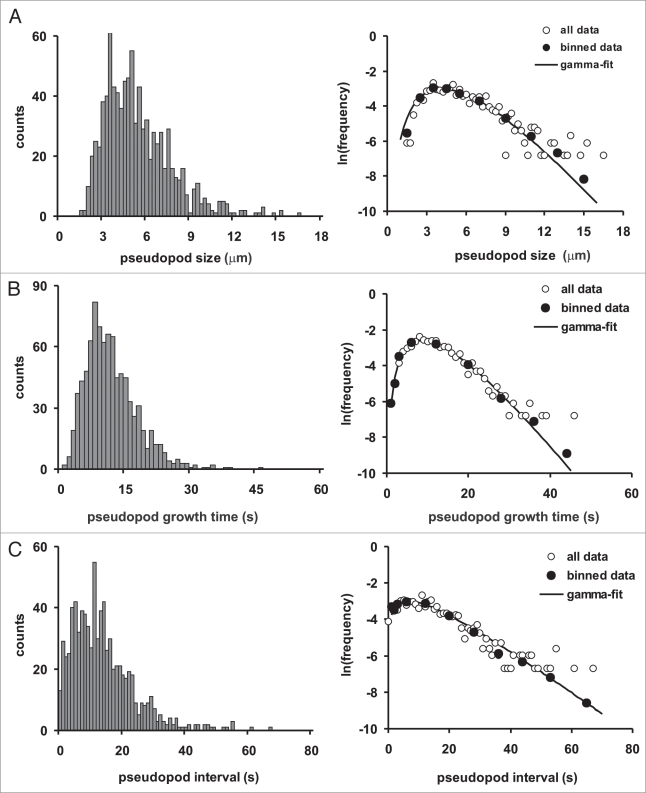
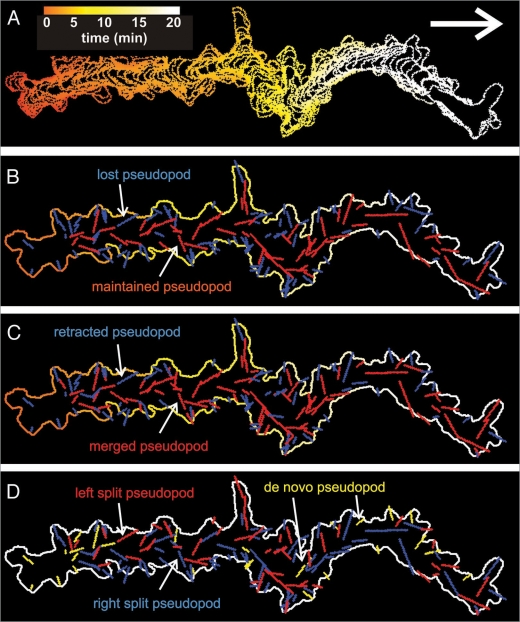
To understand movement of amoeboid cells we have developed an information tool that automatically detects protrusions of moving cells. The algorithm uses digitized cell recordings at a speed of approximately 1 image per second that are analyzed in three steps. In the first part, the outline of a cell is defined as a polygon of approximately 150 nodes, using the previously published Quimp2 program. By comparing the position of the nodes in place and time, each node contains information on position, local curvature and speed of movement. The second part uses rules for curvature and movement to define the position and time of start and end of a growing pseudopod. This part of the algorithm produces quantitative data on size, surface area, lifetime, frequency and direction of pseudopod extension. The third part of the algorithm assigns qualitative properties to each pseudopod. It decides on the origin of a pseudopod as splitting of an existing pseudopod or as extension de novo. It also decides on the fate of each pseudopod as merged with the cell body or retracted. Here we describe the pseudopod tool and present the first data based on the analysis of approximately 1,000 pseudopodia extended by Dictyostelium cells in the absence of external cues.


Figures

Figure 1
Figure 1
Decision tree for identification of extending pseudopodia (gray area). The algorithm searches for adjacent convex nodes. Using criteria for convexity, life time and area change, extending pseudopodia are identified. The algorithm searches in the frames of the movie where the area change started and ends, and exports the x,y,t coordinates of the tip of the pseudopod at start and end. After growth stops, the protrusion is still assigned as a pseudopod. A pseudopod disappears because it may merge with other convex areas such as pseudopod or uropod, merge with the cell body, or is actively retracted.
Figure 2
Figure 2
Pseudopod and tangent to surface. The pseudopod algorithm identifies growing pseudopodia by three steps: (i) it identifies a series of adjacent convex nodes, (ii) evaluates the ‘bending’ of the convex nodes, and (iii) sets a minimal growth area. Then the algorithm searches the central convex node (yellow) in the two frames where the area change became positive for the first time (start) and was positive for the last time (end), respectively. The arrow connects these points, and represents the growing pseudopod as a vector with length, timing and directionality. The slope of the tangent to the surface at a specific node (yellow node) was calculated as the weighted average of the angles between a node and its adjacent node up to three nodes away from the central convex node.
Figure 3
Figure 3
Speed of pseudopod movement. The speed of the center convex node was determined before, during and after growth of 20 pseudopodia. For open symbols the data were aligned (at t = 1) at the first frame that the speed increased above 0.4 μm/s, whereas for the closed triangles the data were aligned (at t = 1) at the first frame that the speed decreased below this value. The two curves were placed 12 sec apart, because that is the average growth period of Dictyostelium pseudopodia. Due to equipment vibrations, a point fixed in space will have an apparent speed. This noise was determined for two “stationary” particles (2 × 2 pixels and 3 × 3 pixels) that remained at nearly the same place during 6 minutes (closed circle; 0.14 +/− 0.07 μm/s). The results show that the tip of a growing pseudopod moves at a high speed of 0.59 +/− 0.08 μm/s (means and SD) and moves at a much lower speed of 0.16 +/− 0.06 μm/s before and after the growing period. Furthermore, the switch between slow and fast movement occurs within one frame (1 s). Due to these large and sudden changes in speed, the start and end of pseudopod growth are relatively easy to determine by eye or by computer algorithms.
Figure 4
Figure 4
Probability frequency distributions. The distributions of pseudopod size (A), life time (B) and interval (C) are presented at the left on a linear scale of number of observations, and at the right on a logarithmic scale of frequency. The distributions have exponential tails, and were fitted according to a maximum-likelihood gamma distribution, yielding estimates for the shape parameter k and the rate parameter λ: pseudopod size (A), k = 5.80 +/− 0.27; λ = 1.10 +/− 0.05; pseudopod growth time (B), k = 4.87 +/- 0.26; λ = 0.38.10 +/- 0.02; pseudopod interval (C), k = 1.86 +/− 0.08; λ = 0.128 +/− 0.007. The mean and SD are presented in Table 3.
Figure 5
Figure 5
Tracks of a moving Dictyostelium cell with annotated pseudopodia. A 20-minute phase contrast movie was recorded with wild type Dictyostelium amoeba crawling in buffer. The movie was converted to black and white and analyzed with the pseudopod macro of Quimp3. In (A), the cell track with time-driven coloration is displayed. In (B), the line segments representing all 137 detected pseudopodia are projected. Maintained pseudopodia are colored red, whereas lost pseudopodia are shown in blue. In (C) the fate of the pseudopodia is colored red for retracted and blue for non-retracted pseudopodia (see Table 1 fate of pseudopod with negative (red) and positive (blue) sign). In (D) the de novo pseudopodia are indicated in yellow, the split pseudopodia to the right relative to the parent are colored blue and split pseudopodia to the left are red.

Similar articles

Cited by

References

    1. Le Clainche C, Carlier MF. Regulation of actin assembly associated with protrusion and adhesion in cell migration. Physiol Rev. 2008;88:489–513. - PubMed
    1. Van Haastert PJM, Devreotes PN. Chemotaxis: signalling the way forward. Nat Rev Mol Cell Biol. 2004;5:626–634. - PubMed
    1. Pollard TD. Regulation of actin filament assembly by Arp2/3 complex and formins. Annu Rev Biophys Biomol Struct. 2007;36:451–477. - PubMed
    1. Arrieumerlou C, Meyer T. A local coupling model and compass parameter for eukaryotic chemotaxis. Dev Cell. 2005;8:215–227. - PubMed
    1. Costantino S, Kent CB, Godin AG, Kennedy TE, Wiseman PW, Fournier AE. Semi-automated quantification of filopodial dynamics. J Neurosci Methods. 2008;171:165–173. - PubMed

LinkOut - more resources