. 2009 Nov 16:3:48.
doi: 10.3389/neuro.09.048.2009. eCollection 2009.

Differential maturation of brain signal complexity in the human auditory and visual system

Affiliations

Differential maturation of brain signal complexity in the human auditory and visual system

Sarah Lippé et al. Front Hum Neurosci. .

Abstract

Brain development carries with it a large number of structural changes at the local level which impact on the functional interactions of distributed neuronal networks for perceptual processing. Such changes enhance information processing capacity, which can be indexed by estimation of neural signal complexity. Here, we show that during development, EEG signal complexity increases from one month to 5 years of age in response to auditory and visual stimulation. However, the rates of change in complexity were not equivalent for the two responses. Infants' signal complexity for the visual condition was greater than auditory signal complexity, whereas adults showed the same level of complexity to both types of stimuli. The differential rates of complexity change may reflect a combination of innate and experiential factors on the structure and function of the two sensory systems.

Keywords: EEG; audition; complexity; development; entropy; infant; signal; vision.


Figures
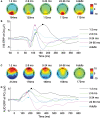
Figure 1
Figure 1
Visual and auditory evoked potentials. (A,B) Group average of the visual evoked potentials. (A) Topographies at the latency of the highest amplitude peak for each group. (B) Group average waveforms at electrode Oz. (C,D) Group average of the auditory evoked potentials. (C) Topographies at the latency of the highest amplitude peak for each group. (D) Group average waveforms at electrode FCz.
Figure 2
Figure 2
Age-related differences in multiscale entropy estimated separately in VIS and AUD conditions. Left panels show group mean entropy with error bars representing group standard errors. Right panels show PLS contrasts representing age-related increase in entropy. Contrasts for both conditions were significant and stably expressed across all temporal scales.
Figure 3
Figure 3
Age-related differences in spectral power distribution estimated separately in VIS and AUD conditions. Left panels show group mean log power with error bars representing group standard errors. Middle panels show PLS contrasts representing age-related change of spectral power distribution. Contrasts for both conditions were significant and stably expressed across most frequencies as shown in right panels. Results from both conditions replicate a known shift towards higher frequencies during maturation. Loss of stability around 6 Hz is likely due to an interaction between development-related increase in alpha rhythm frequency (Marshall et al., 2002) and the overall redistribution of power towards higher frequencies.
Figure 4
Figure 4
Multi scale entropy in VIS vs. AUD conditions across five age groups. Group mean entropy is shown for VIS and AUD conditions, together with group standard errors. The outcome of the significance testing for differences in MSE between two conditions within each group are given as p values. The adult group showed no significant differences between the two conditions. Bottom right panel shows PLS contrast between VIS and AUD conditions across all five groups simultaneously, after correcting for overall group differences. The contrast was significant and stably expressed across all four temporal scales. VIS condition exhibits higher MSE compared to AUD condition across all groups and the difference is most strongly expressed in the second group (2–8 months) in relation to other groups.
Figure 5
Figure 5
Spectral power distribution in VIS vs. AUD conditions across five age groups. Group mean log power in VIS and AUD conditions is displayed, together with group standard errors. The outcome of significance testing for differences in spectral power distribution between two conditions within each group are given as p-values. The circles above the frequencies indicate portions of the spectral power curve that differ between conditions based on a 99% confidence interval derived from bootstrap estimation. The adult group showed no significant differences between the two conditions. The bottom right panel shows PLS contrast between VIS and AUD conditions across all five groups simultaneously, after correcting for group differences. The contrast was significant and stably expressed across almost all frequencies. VIS condition exhibits less low and more high frequencies compared to AUD condition across all groups and the difference is most strongly expressed in the second group (2–8 months).

References

    1. Ali A. B., Bannister A. P., Thomson A. M. (2007). Robust correlations between action potential duration and the properties of synaptic connections in layer 4 interneurones in neocortical slices from juvenile rats and adult rat and cat. J. Physiol. 580, 149–16910.1113/jphysiol.2006.124214 - DOI - PMC - PubMed
    1. Atkinson J., Braddick O. (1992). Visual segmentation of oriented textures by infants. Behav. Brain Res. 49, 123–13110.1016/S0166-4328(05)80202-5 - DOI - PubMed
    1. Bayley N. (1993). Bayley Scale of Infant Development, 2nd Edn.The psychological corporation, Harcourt Brace and Company, San Antonio
    1. Burkhalter A. (1993). Development of forward and feedback connections between areas V1 and V2 of human visual cortex. Cereb. Cortex 3, 476–48710.1093/cercor/3.5.476 - DOI - PubMed
    1. Ceponiene R., Cheour M., Naatanen R. (1998). Interstimulus interval and auditory event-related potentials in children: evidence for multiple generators. Electroencephalogr. Clin. Neurophysiol. 108, 345–35410.1016/S0168-5597(97)00081-6 - DOI - PubMed

LinkOut - more resources