. 2009 Oct 26:3:14.
doi: 10.3389/neuro.06.014.2009. eCollection 2009.

Digital, Three-dimensional Average Shaped Atlas of the Heliothis Virescens Brain with Integrated Gustatory and Olfactory Neurons

Affiliations

Digital, Three-dimensional Average Shaped Atlas of the Heliothis Virescens Brain with Integrated Gustatory and Olfactory Neurons

Pål Kvello et al. Front Syst Neurosci. .

Abstract

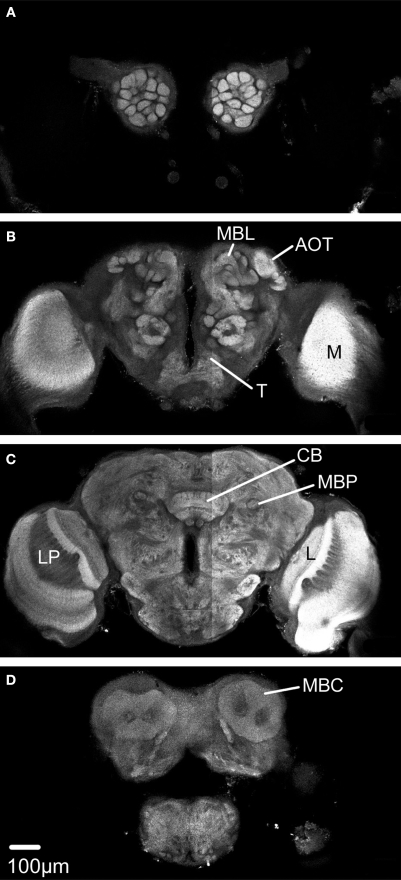
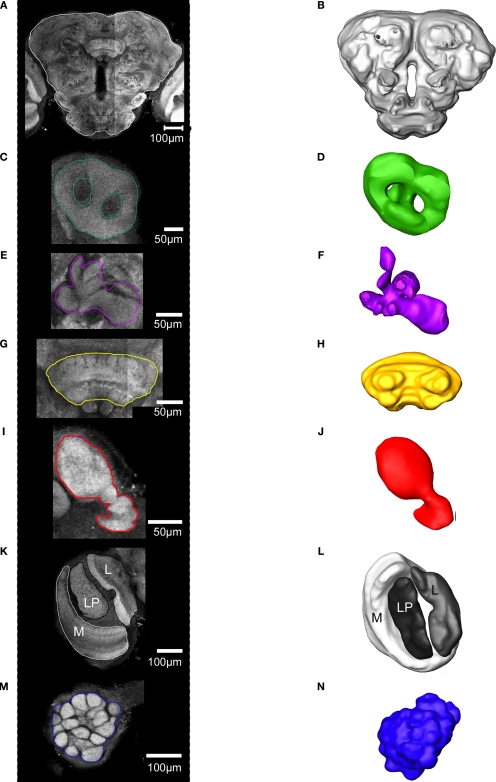
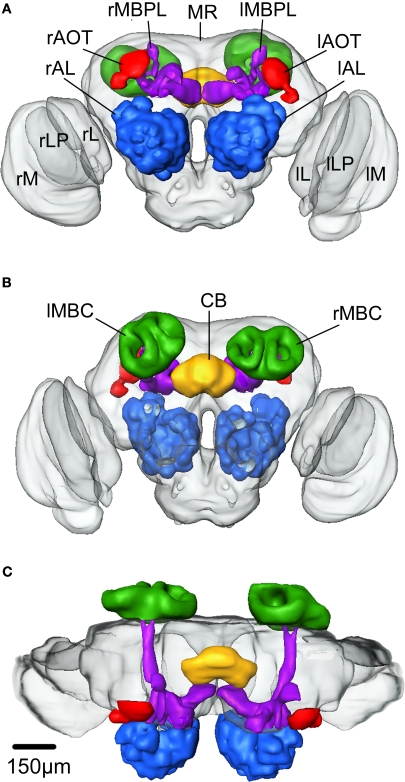
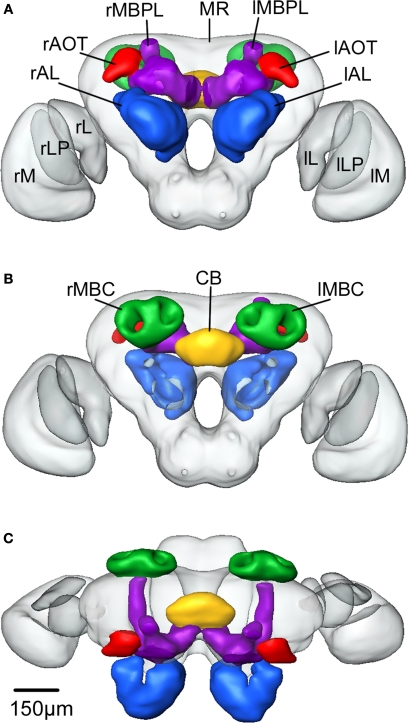
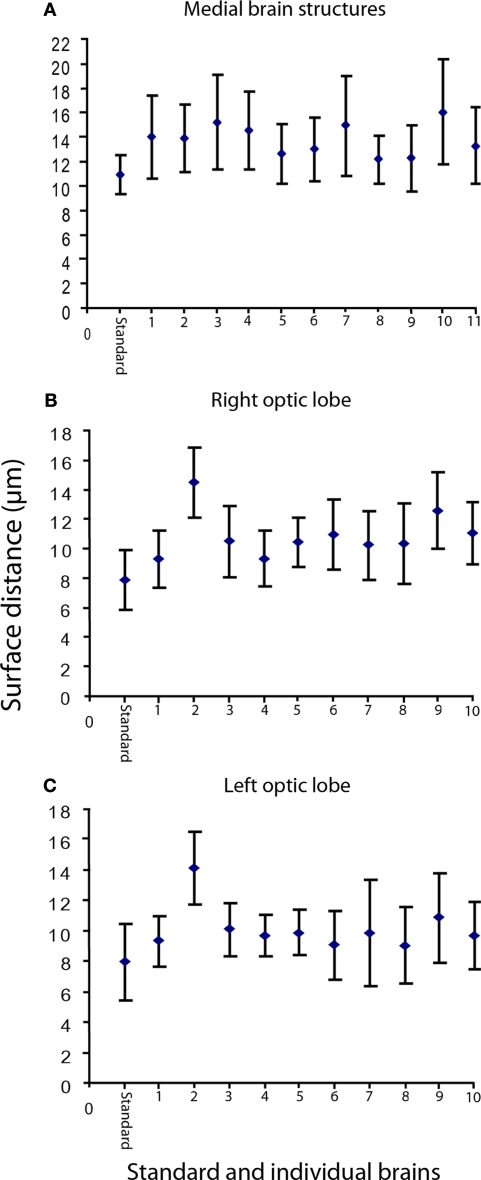
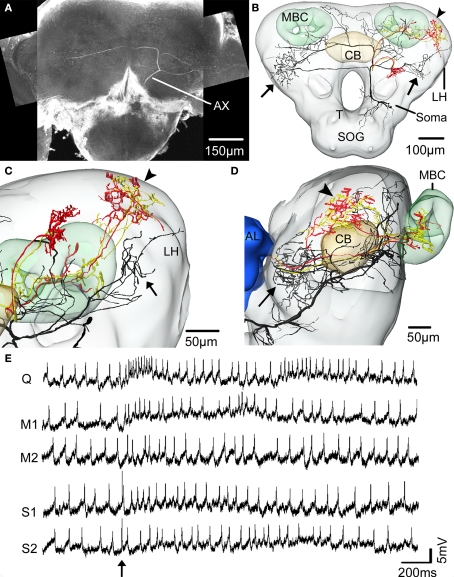
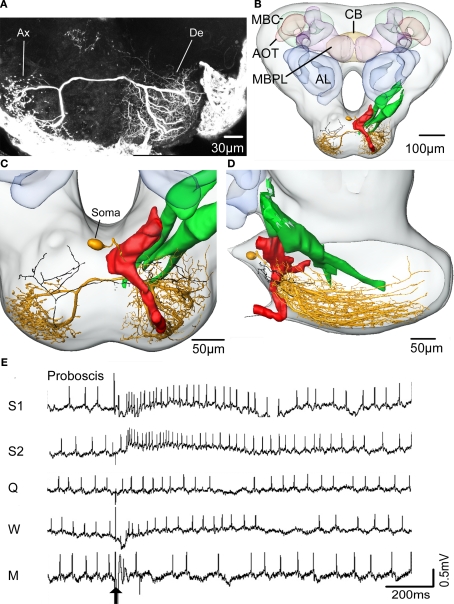
We use the moth Heliothis virescens as model organism for studying the neural network involved in chemosensory coding and learning. The constituent neurons are characterised by intracellular recordings combined with staining, resulting in a single neuron identified in each brain preparation. In order to spatially relate the neurons of different preparations a common brain framework was required. We here present an average shaped atlas of the moth brain. It is based on 11 female brain preparations, each stained with a fluorescent synaptic marker and scanned in confocal laser-scanning microscope. Brain neuropils of each preparation were manually reconstructed in the computer software Amira, followed by generating the atlas using the Iterative Shape Average Procedure. To demonstrate the application of the atlas we have registered two olfactory and two gustatory interneurons, as well as the axonal projections of gustatory receptor neurons into the atlas, visualising their spatial relationships. The olfactory interneurons, showing the typical morphology of inner-tract antennal lobe projection neurons, projected in the calyces of the mushroom body and laterally in the protocerebral lobe. The two gustatory interneurons, responding to sucrose and quinine respectively, projected in different areas of the brain. The wide projections of the quinine responding neuron included a lateral area adjacent to the projections of the olfactory interneurons. The sucrose responding neuron was confined to the suboesophageal ganglion with dendritic arborisations overlapping the axonal projections of the gustatory receptor neurons on the proboscis. By serving as a tool for the integration of neurons, the atlas offers visual access to the spatial relationship between the neurons in three dimensions, and thus facilitates the study of neuronal networks in the Heliothis virescens brain. The moth standard brain is accessible at http://www.ntnu.no/biolog/english/neuroscience/brain.

Keywords: insect; neuron; olfaction; taste; three-dimensional reconstruction.


Figures

Figure 1
Figure 1
Confocal images of the Heliothis virescens brain immunostained with the synaptic marker SYNORF 1. Sections from anterior to posterior at depths 30 μm, 100 μm, 162 μm and 246 μm. (A) Right and left antennal lobes with olfactory glomeruli. (B–D) Anterior optic tubercle (AOT), mushroom body lobes (MBL), tritocerebrum (T), central body (CB), medulla (M), lobula (L), Lobula plate (LP), mushroom body peduncle (MBP) and mushroom body calyces (MBC). Light intensity difference is due to merging of two image stacks with different light intensities.
Figure 2
Figure 2
The structures included in the Heliothis virescens standard brain atlas visualized by confocal images including their labelled outline (left) and surface reconstructions (right). The images are from a single brain preparation. (A,B) Midbrain region. (C,D) Mushroom body calyx. (E,F) Mushroom body peduncle and lobes. (G,H) Central body. (I,J) Anterior optic tubercle. (K,L) Optic lobe neuropils including the medulla (M), lobula plate (LP) and lobula (L). (M,N) Antennal lobe glomeruli. Light intensity difference is due to merging of two image stacks with different light intensities.
Figure 3
Figure 3
Surface reconstruction of an individual brain of Heliothis virescens. (A) Anterior view. (B) Posterior view. (C) Dorsal view. Midbrain region (MR), right mushroom body calyces (rMBC), right mushroom body peduncle and lobes (rMBPL), central body (CB), right anterior optic tubercle (rAOT), right antennal lobe (rAL), right medulla (rM), right lobula plate (rLP), right lobula (rL), left mushroom body calyces (lMBC), left mushroom body peduncle and lobes (lMBPL), left anterior optic tubercle (lAOT), left antennal lobe (lAL), left medulla (lM), left lobula plate (lLP), left lobula (lL).
Figure 4
Figure 4
The average standard brain of Heliothis virescens. (A) Anterior view. (B) Posterior view. (C) Dorsal view. Midbrain region (MR), right mushroom body calyces (rMBC), right mushroom body peduncle and lobes (rMBPL), central body (CB), right anterior optic tubercle (rAOT), right antennal lobe (rAL), right medulla (rM), right lobula plate (rLP), right lobula (rL), left mushroom body calyces (lMBC), left mushroom body peduncle and lobes (lMBPL), left anterior optic tubercle (lAOT), left antennal lobe (lAL), left medulla (lM), left lobula plate (lLP), left lobula (lL).
Figure 5
Figure 5
The mean surface distance between the standard brain and the individual brains, as well as between each individual brain and the other brains. (A) The mean distance between the standard (the medial brain structures) and the 11 individual brains is 11.0 μm, whereas the mean distance between the individual brains range from 12.2 to 16.1 μm. (B) The right optic lobe. The mean distance between the standard and the 10 individual brains is 8.0 μm, whereas the mean distance between the individual brains range from 9.3 to 14.5 μm (C) The left optic lobe. The mean distance between the standard and the 10 individual brains is 8.0 μm, whereas the mean distance between the individual brains range from 9.1 to 14.2 μm. On average the standard brain is more similar to each individual brain than the individual brains are to each other. The vertical bars show the standard deviation.
Figure 6
Figure 6
Confocal images and registration of two antennal lobe projection neurons (simultaneously stained) into the average standard brain atlas of Heliothis virescens. (A) Confocal image of a section showing Micro-Ruby stained dendrites (De) of two antennal lobe projection neurons innervating a single glomerulus (Gl). Their branching pattern within the glomerulus could not be distinguished. (B) Confocal image showing the projections of the two neurons in the mushroom body calyces and in the lateral part of the protocerebral lobe. (C,D) Reconstruction of the left protocerebral lobe with the two neurons innervating one glomerulus (Gl) of the antennal lobe (AL), the mushroom bodies calyces (MBC) and the lateral protocerebral lobe (LPL) in a frontal view (C) and lateral view (D). One branch of both axons extends into the lateral horn (LH). (E,F) The two neurons registered into the standard brain atlas in a frontal view (E) and lateral view (F). Central body (CB).
Figure 7
Figure 7
The spatial relationship between a single gustatory interneuron and the two antennal lobe projection neurons visualised in the standard brain atlas of Heliothis virescens. (A) Confocal image of a brain section showing the gustatory interneuron stained with Micro-Emerald. Axon (Ax). (B) Reconstruction of the gustatory interneuron (black) and the two antennal lobe projection neurons (yellow and red) registered into the standard brain atlas (frontal view with selected brain structures). Mushroom body calyces (MBC), Central body (CB), Lateral horn (LH), Suboesophageal ganglion (SOG), Tritocerebrum (T). (C,D) Magnified sections of the lateral parts of the left protocerebral lobe in a frontal view (C) and a lateral view (D). The segregated axonal projections of the gustatory interneuron and the antennal lobe projection neurons appear. Arrows point to the axonal projections of the gustatory interneuron and the arrowheads to the axonal projections of the antennal lobe projection neurons. Antennal lobe (AL). (E) Electrophysiological recordings from the interneuron during stimulation of the right antenna with quinine (Q), mechanosensory stimuli (M1, M2) and sucrose (S1, S2). Arrow points to the stimulus onset.
Figure 8
Figure 8
The spatial relationship between a single gustatory interneuron and the axonal projections of the antennal and proboscis gustatory receptor neurons visualized in the standard brain atlas of the Heliothis virescens. (A) Confocal image of a section of the suboesophageal ganglion with a Micro-Ruby stained gustatory interneuron. Axon (Ax), Dendrite (De). (B) The gustatory interneuron (yellow) and the axonal projections of the antennal (green) and proboscis (red and black) gustatory receptor neurons registered into the standard brain atlas (frontal view with a few selected structures) Mushroom body calyces (MBC), Anterior optic tubercle (AOT), Mushroom body peduncle and lobes (MBPL), Antennal lobe (AL), Central body (CB). (C,D) Magnified section of the suboesophageal ganglion in a frontal view (C) and a lateral view (D). The axon terminals of the proboscis gustatory receptor neuron (black) overlap the dendritic arborisations of the gustatory interneuron with direct contact between a few of the neurites. (E) Electrophysiological recordings from the interneuron during stimulation of the proboscis with sucrose (S1, S2), quinine (Q), water (W) and a mechanosensory stimulus (M). Arrow points to the stimulus onset.

Similar articles

Cited by

References

    1. Berg B. G., Almaas T. J., Bjaalie J. G., Mustaparta H. (1998). The macroglomerular complex of the antennal lobe in the tobacco budworm moth Heliothis virescens: specified subdivision in four compartments according to information about biologically significant compounds. J. Comp. Physiol. A 183, 669–68210.1007/s003590050290 - DOI
    1. Berg B. G., Galizia C. G., Brandt R., Mustaparta H. (2002). Digital atlases of the antennal lobe in two species of tobacco budworm moths, the oriental Helicoverpa assulta (male) and the American Heliothis virescens (male and female). J. Comp. Neurol. 446, 123–13410.1002/cne.10180 - DOI - PubMed
    1. Borst A., Haag J. (2002). Neural networks in the cockpit of the fly. J. Comp. Physiol. A 188, 419–43710.1007/s00359-002-0316-8 - DOI - PubMed
    1. Brandt R., Rohlfing T., Rybak J., Krofczik S., Maye A., Westerhoff M., Hege H. C., Menzel R. (2005). Tree-dimensional average-shape atlas of the honeybee brain and its applications. J. Comp. Neurol. 492, 1–1910.1002/cne.20644 - DOI - PubMed
    1. Bräunig P., Pflüger H.-J. (2001). The unpaired median neurons of insects. Adv. In Insect Phys. 28, 185–266

LinkOut - more resources