. 2009 May;91(3):293-317.
doi: 10.1901/jeab.2009.91-293.

Dynamics of choice: relative rate and amount affect local preference at three different time scales

Affiliations

Dynamics of choice: relative rate and amount affect local preference at three different time scales

Carlos F Aparicio et al. J Exp Anal Behav. 2009 May.

Abstract

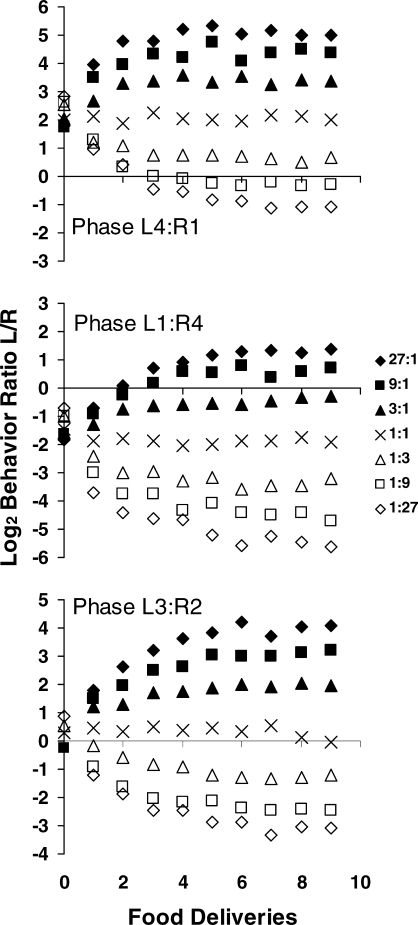
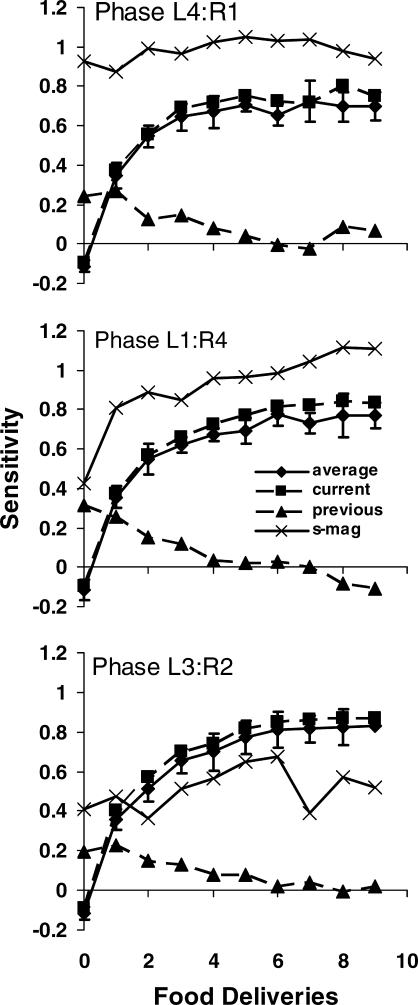
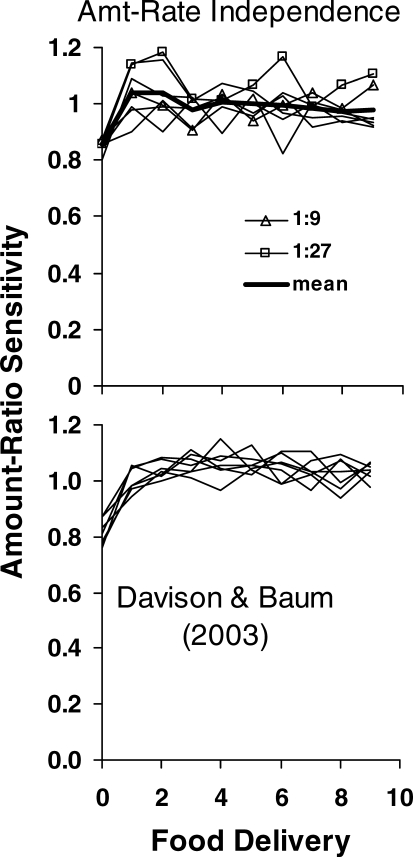
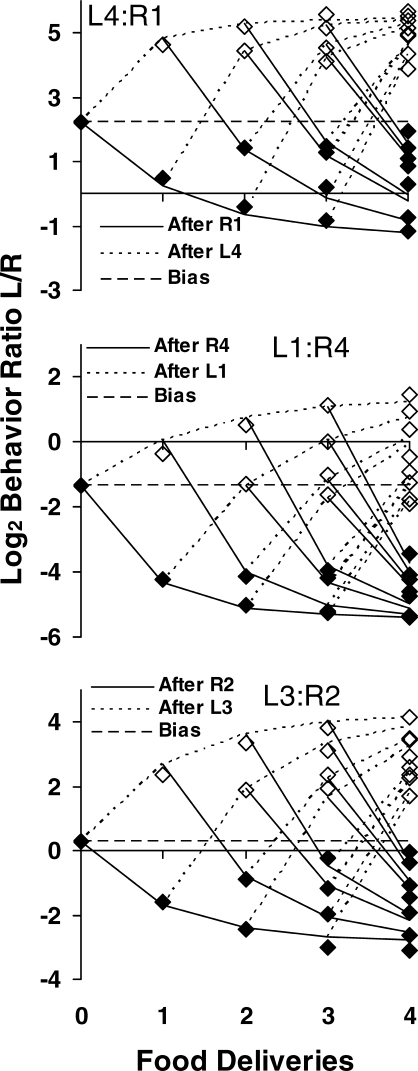
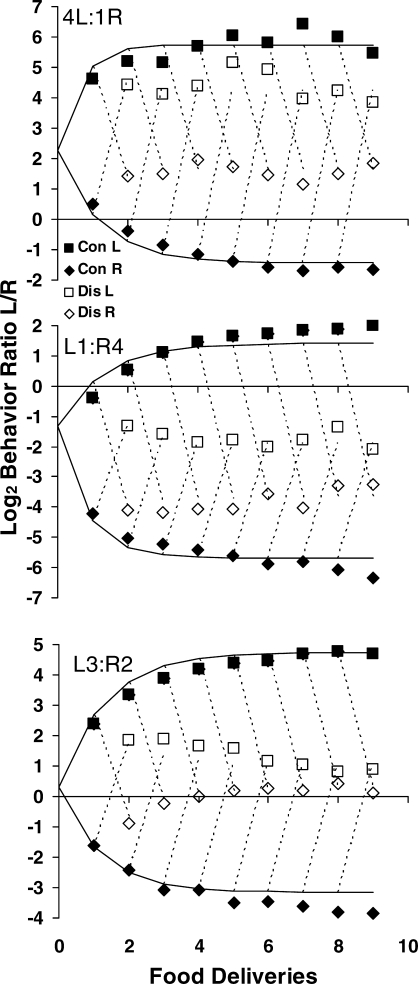
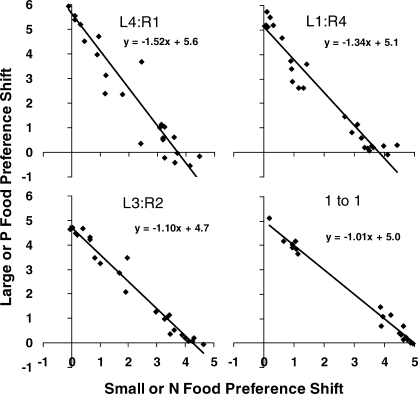
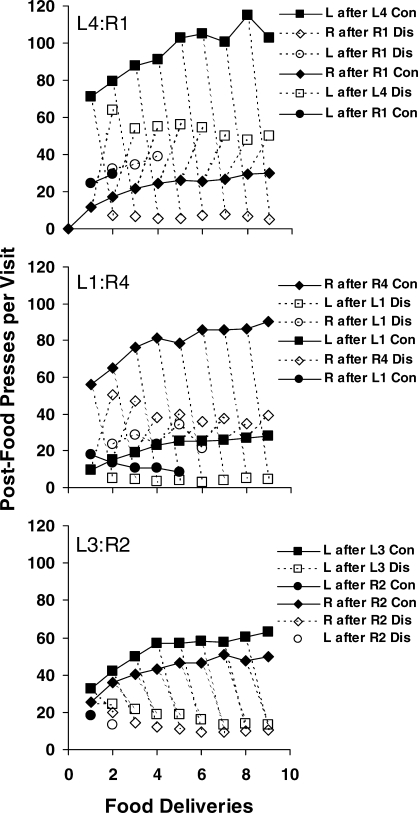
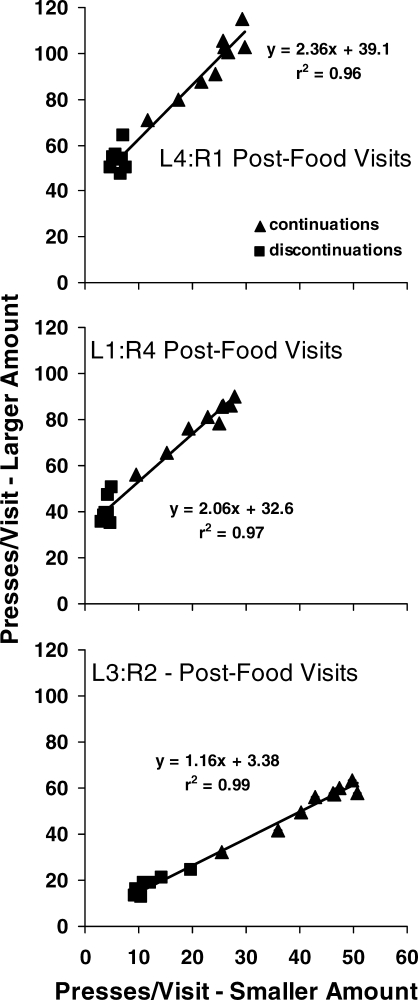
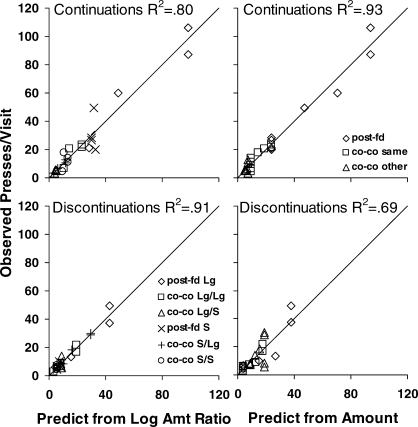
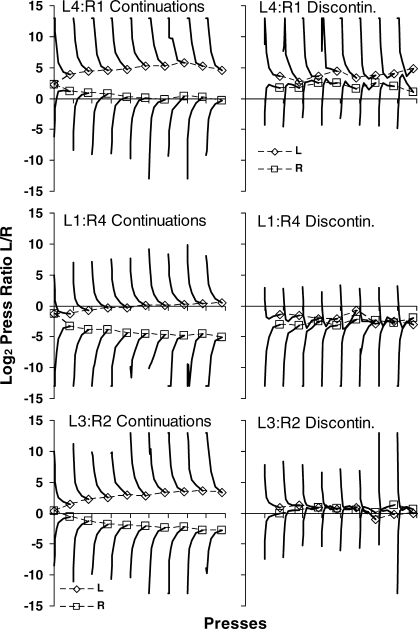
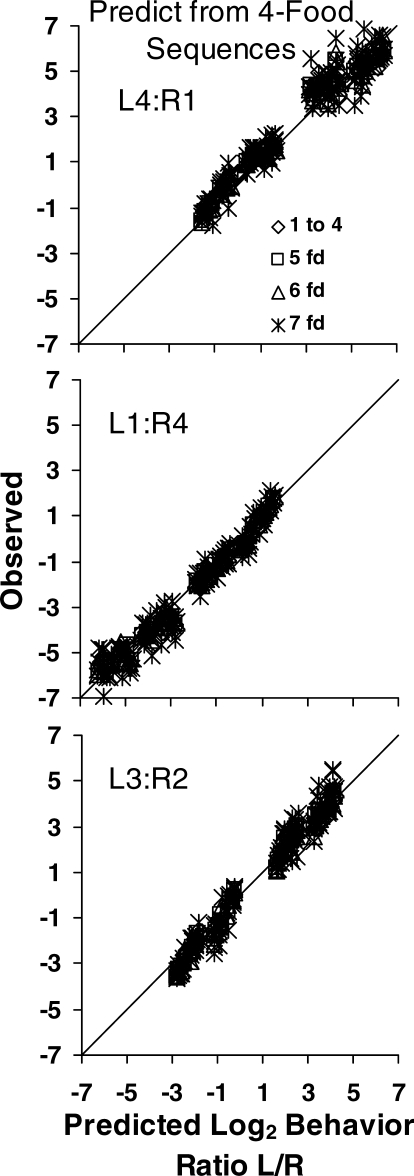
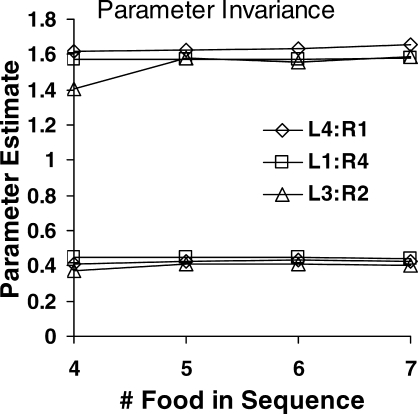
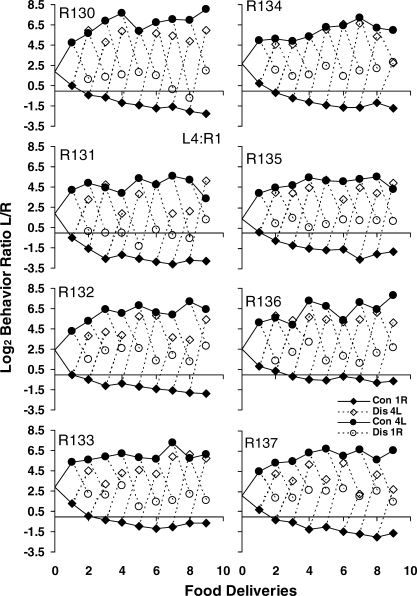
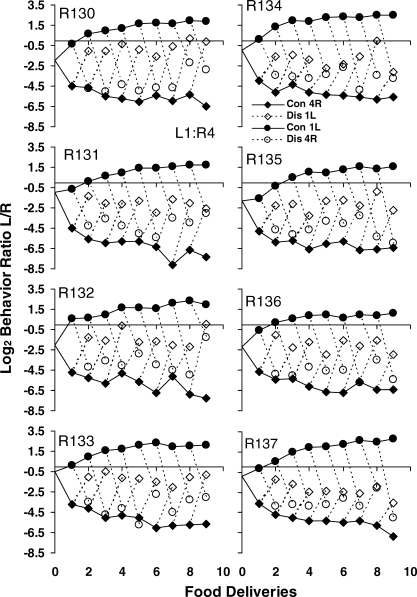
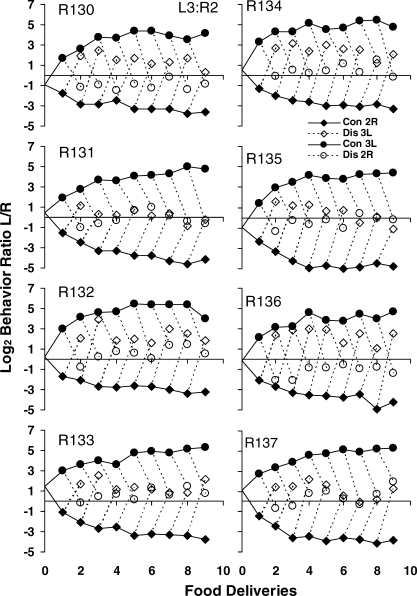
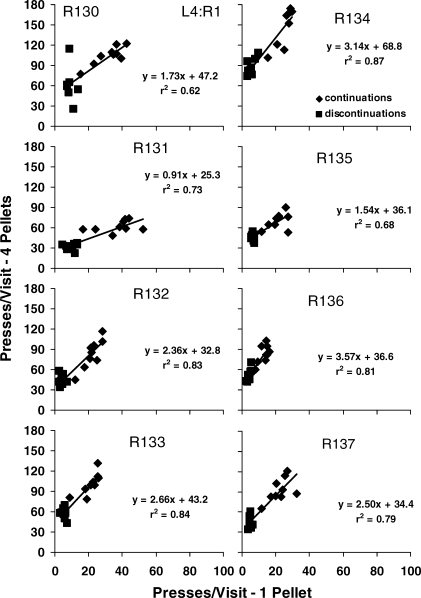
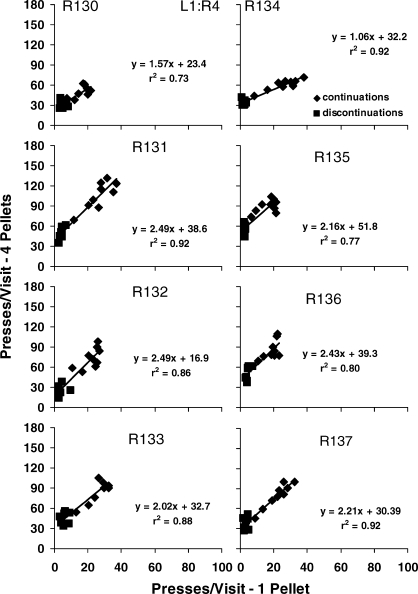
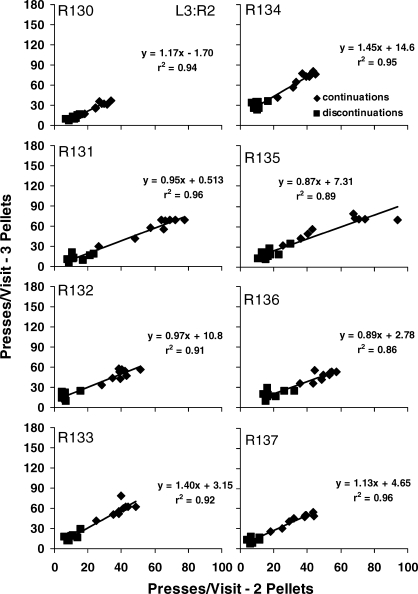
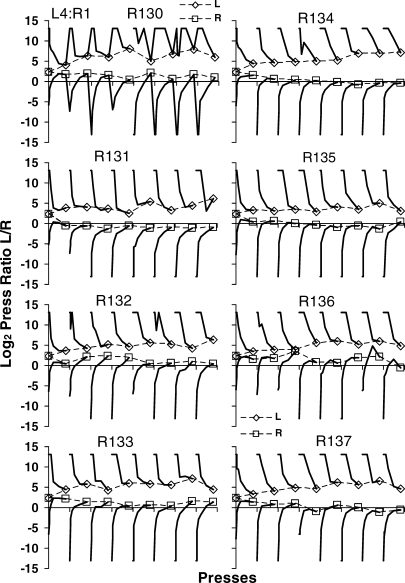
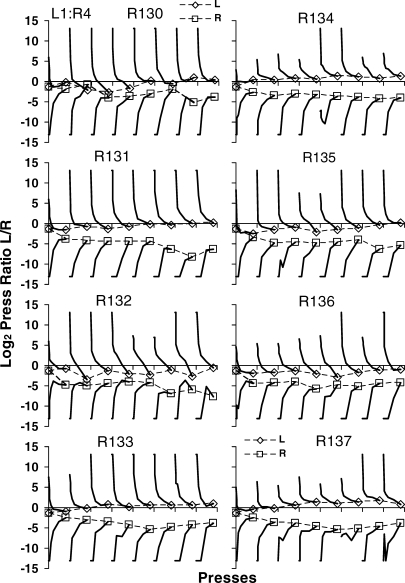
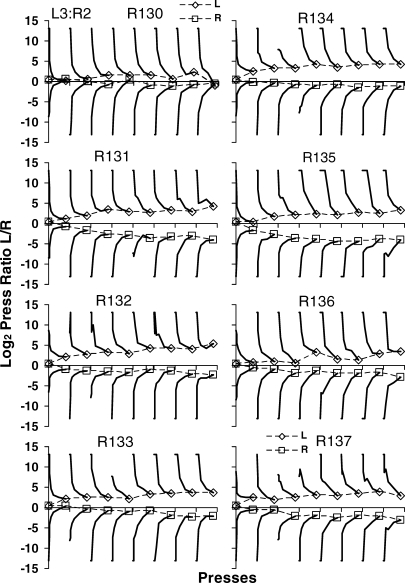
To examine extended control over local choice, the present study investigated preference in transition as food-rate ratio provided by two levers changed across seven components within daily sessions, and food-amount ratio changed across phases. Phase 1 arranged a food-amount ratio of 4:1 (i.e., the left lever delivered four pellets and the right lever one pellet); Phase 2 reversed the food-amount ratio to 1:4, and in Phase 3 the food-amount ratio was 3:2. At a relatively extended time scale, preference was described well by a linear relation between log response ratio and log rate ratio (the generalized matching law). A small amount of carryover occurred from one rate ratio to the next but disappeared after four food deliveries. Estimates of sensitivity to food-amount ratio were around 1.0 and were independent of rate ratio. Analysis across food deliveries within rate-ratio components showed that the effect of a small amount was diminished by the presence of a large amount-that is, when a larger amount was present in the situation (three or four pellets), the value of a small amount (one or two pellets) became paltry. More local analysis of visits to the levers between food deliveries showed that postfood visits following a large amount were disproportionately longer than following a small amount. Continuing food deliveries from the same source tended to make visits less dependent on relative amount, but a discontinuation (i.e., food from the other lever) reinstated dependence on relative amount. Analysis at a still smaller time scale revealed preference pulses following food deliveries that confirmed the tendency toward dependence on absolute amount with continuing deliveries, and toward dependence on relative amount following discontinuations. A mathematical model based on a linear-operator equation accounts for many of the results. The larger and longer preference following a switch to a larger amount is consistent with the idea that local preference depends on relatively extended variables even on short time scales.

Keywords: choice; dynamics; food amount; food rate; matching law; preference pulse; rats.


Figures

Fig 1
Fig 1
Log (base 2) behavior ratios (Left/Right) in each of the seven components as a function of successive food deliveries. The data were grouped over the 8 rats. L and R indicate left and right for the amount ratios of 4∶1 (top panel), 1∶4 (middle panel), and 3∶2 (bottom panel).
Fig 2
Fig 2
Sensitivity to food ratio (s in Equation 1) as a function of food deliveries in a component. The diamonds represent mean sensitivity to obtained food ratio across the 8 rats, and the error bars show one standard deviation above and below the means. The squares and triangles show the slopes from multiple regression using current log food-rate ratio and prior final log behavior ratio (following the ninth food delivery) as the predictor variables. The Xs show point estimates of sensitivity to amount ratio. Points plotted at zero on the x-axis indicate performance before any food was delivered.
Fig 3
Fig 3
Top: Sensitivity to food-amount ratio as a function of successive food deliveries. For each rate-ratio component and each food delivery within a component, Equation 1 was fitted to the three behavior ratios for the three amount ratios, across phases. The amount sensitivity was the slope of the fitted line. Each lighter line shows amount sensitivity for one rate ratio. Squares and triangles indicate the 1∶9 and 1∶27 rate ratios, and the heavy line shows the mean across components. Bottom: a similar analysis, done at our behest by Michael Davison, of the results from a similar experiment with pigeons. Each point represents the slope of Equation 1 fitted to seven behavior ratios for seven amount ratios. Each line represents amount sensitivity across food deliveries for one rate-ratio, within-session component.
Fig 4
Fig 4
Log (base 2) interfood behavior ratio (Left/Right) as a function of source sequence of food for the first four food deliveries within components. The broken horizontal line in each graph represents bias due to the amount difference, and the lines show the results of fitting Equation 3. The open symbols indicate choice following a food delivery from the left lever, and filled symbols choice following a food delivery from the right lever.
Fig 5
Fig 5
Log (base 2) interfood behavior ratio (Left/Right) within components across nine food deliveries from the same lever (continuations; filled symbols) and following a food delivery from the other lever (a discontinuation; unfilled symbols). The lines are the results of fitting Equation 3.
Fig 6
Fig 6
For the three amount ratios and an earlier experiment (Aparicio & Baum, 2006), the amount by which preference shifted following the larger food delivery versus the shift following the smaller food delivery. Each point represents a comparison following a particular sequence of large and small food deliveries (for example, 4-1-1-4 versus 4-1-1-1). For the earlier experiment, in which the amount ratio was 1:1, P signifies the lever (left or right) that delivered the first pellet in the component, and N represents the other, not-first lever. Lines and equations represent the results of least-squares regression.
Fig 7
Fig 7
For the three amount ratios: length (presses per visit) of the first visit following a series of continuing food deliveries or following a series of continuing food deliveries ending with a discontinuation as a function of number of food deliveries. Group data are shown for visits following each of the nine food deliveries. Filled symbols represent visits following continuations, and unfilled symbols visits following a discontinuation. L stands for the left lever, R for the right lever, Con for continuation, and Dis for discontinuation.
Fig 8
Fig 8
For the three amount ratios: visit length (presses per visit) following the larger amount as a function of the comparable visit length following the smaller amount, replotted from Figure 7. The sequences of food deliveries are mirror images—for example, 4-4-4-4 versus 1-1-1-1 or 1-1-1-4 versus 4-4-4-1. Triangles indicate continuations and squares discontinuations.
Fig 9
Fig 9
Postfood (post-fd) and postchangeover (co-co) presses per visit following continuations (top row) and discontinuations (bottom row) plotted against predicted presses per visit. Predictions were derived by regressing visit length against either the log amount ratio (left-hand graphs) or the absolute amount of food (right-hand graphs). In the legend, Lg means larger, S means smaller, Lg/S means a visit to the smaller-amount lever following a larger food delivery, and S/Lg means a visit to the larger-amount lever following a smaller food delivery. Absolute amount predicts visits better (R2) following continuations, whereas relative amount predicts better following a discontinuation. See text for more explanation.
Fig 10
Fig 10
For the three amount ratios: preference pulses between food deliveries; log (Left/Right) response ratio versus presses across nine food deliveries. Curves were constructed by calculating preference for press 1, presses 2 and 3, presses 4-7, presses 8-15, presses 16-31, presses 32-63, and presses 64-100. The final points of the preference curves are given symbols (squares for the left and diamonds for the right lever) and connected. The left-hand graphs show preference pulses following one to nine continuations, and the right-hand graphs show those following discontinuations after one to eight prior continuations. See text for more details.
Fig 11
Fig 11
For the three amount ratios: observed log (Left/Right) behavior ratio versus predicted log (Left/Right) behavior ratio. Equation 3 was fitted to preferences following the 16 source sequences of four food deliveries, and the parameters of that fit were used to predict preferences following all sequences of food sources (left and right levers) up to sequences of seven food deliveries. See text for more details.
Fig 12
Fig 12
Invariance of the parameters g and w in Equation 3 across different sequence lengths and the three amount ratios. Each sequence length represents a different subset of the data used to predict the rest. See text for more details.
Fig A1
Fig A1
Interfood behavior ratios for individual rats in the phase in which the left lever delivered four pellets and the right lever one pellet. Filled symbols and solid lines show preference following continuations, and unfilled symbols and broken lines show preference following discontinuations. Con stands for continuation. Dis stands for discontinuation. R stands for right; L stands for left.
Fig A2
Fig A2
Interfood behavior ratios for individual rats in the phase in which the left lever delivered one pellet and the right lever four pellets. Other details as in Figure A1.
Fig A3
Fig A3
Interfood behavior ratios for individual rats in the phase in which the left lever delivered three pellets and the right lever two pellets. Other details as in Figure A1.
Fig A4
Fig A4
For individual rats in the phase in which the left lever delivered four pellets and the right lever one pellet: visit length (presses per visit) following the larger amount as a function of the comparable visit length following the smaller amount, as in Figure 8. The sequences of food deliveries are mirror images—for example, 4-4-4-4 versus 1-1-1-1 or 1-1-1-4 versus 4-4-4-1. Triangles indicate continuations and squares discontinuations.
Fig A5
Fig A5
For individual rats in the phase in which the left lever delivered one pellet and the right lever four pellets. Other details as in Figure A4.
Fig A6
Fig A6
For individual rats in the phase in which the left lever delivered three pellets and the right lever two pellets. Other details as in Figure A4.
Fig A7
Fig A7
Preference pulses following continuing food deliveries up to the eighth food delivery in components in the phase in which the left lever delivered four pellets and the right lever one pellet. Curves were constructed by calculating preference for press 1, presses 2 and 3, presses 4-7, presses 8-15, presses 16-31, presses 32-63, and presses 64-100. The symbols and lines show the final points of the curves. See text for more explanation.
Fig A8
Fig A8
Preference pulses following continuing food deliveries up to the eighth food delivery in components in the phase in which the left lever delivered one pellet and the right lever four pellets. Other details as in Figure A7.
Fig A9
Fig A9
Preference pulses following continuing food deliveries up to the eighth food delivery in components in the phase in which the left lever delivered three pellets and the right lever two pellets. Other details as in Figure A7.

References

    1. Aparicio C.F. Overmatching in rats: The barrier choice paradigm. Journal of the Experimental Analysis of Behavior. 2001;75:93–106. - PMC - PubMed
    1. Aparicio C.F. Haloperidol, dynamics of choice, and the parameters of the matching law. Behavioural Processes. 2007;75(2):206–212. - PubMed
    1. Aparicio C.F. Dynamics of choice and frequency of environment change. Behavioural Processes. 2008;78(2):165–172. - PubMed
    1. Aparicio C.F, Barajas A. Dynamic changes in reinforcement contingencies of a choice situation: Steady state concurrent performance is required. Mexican Journal of Behavior Analysis. 2002;28:67–90.
    1. Aparicio C.F, Baum W.M. Comparing locomotion with lever-press travel in an operant simulation of foraging. Journal of the Experimental Analysis of Behavior. 1997;68:177–192. - PMC - PubMed

Publication types

LinkOut - more resources