. 2009 May;91(3):319-35.
doi: 10.1901/jeab.2009.91-319.

Within-session transitions in choice: a structural and quantitative analysis

Affiliations

Within-session transitions in choice: a structural and quantitative analysis

Kelly M Banna et al. J Exp Anal Behav. 2009 May.

Abstract

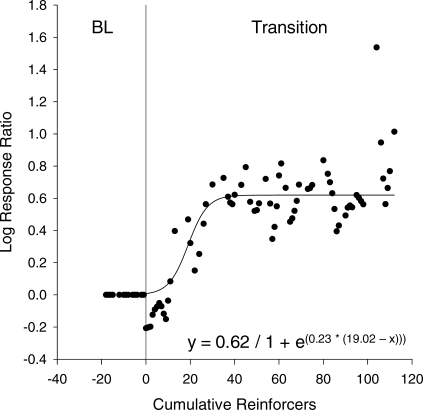
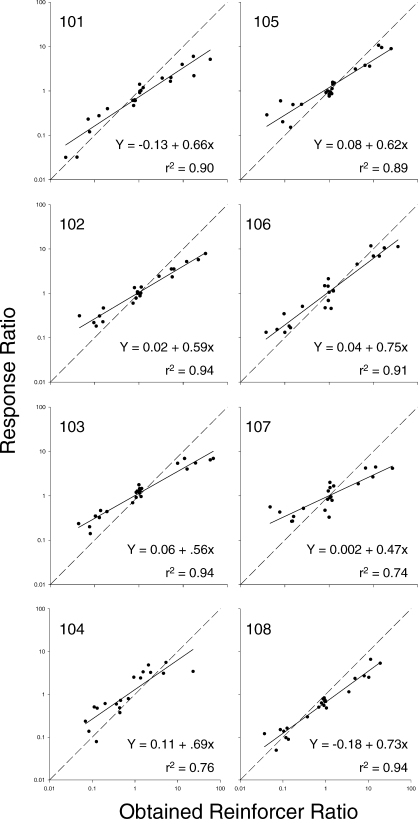
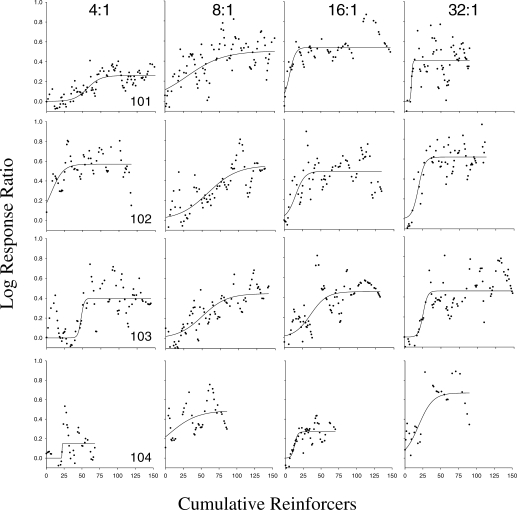
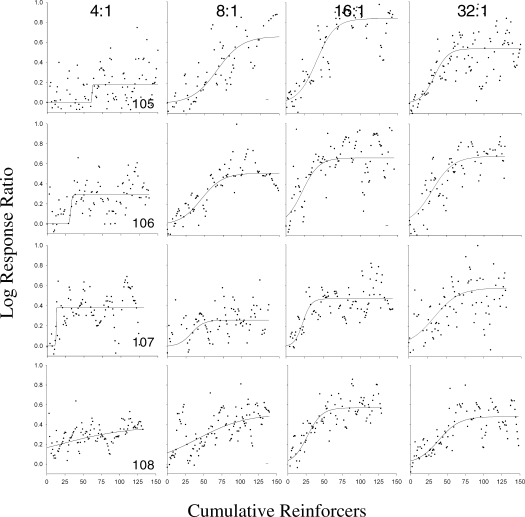
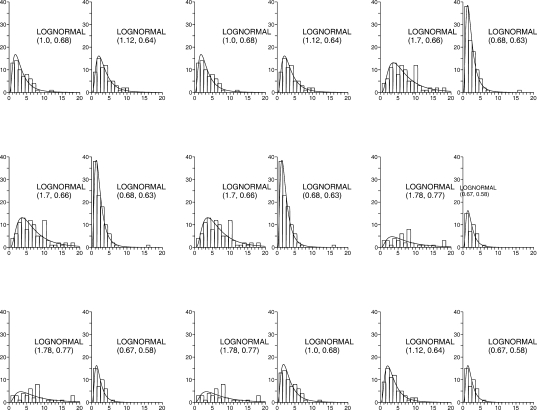
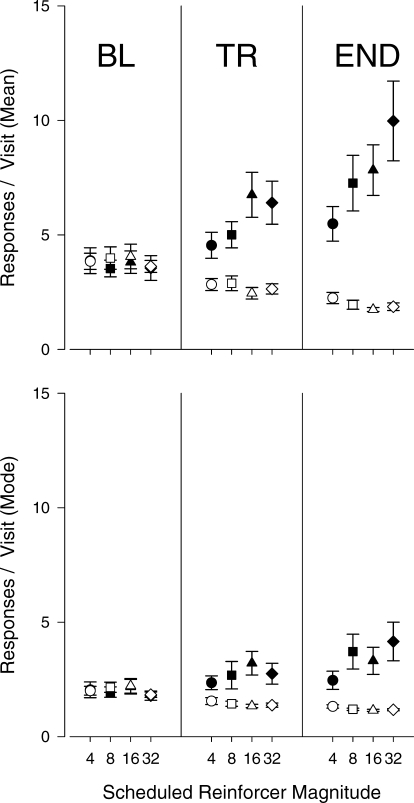
The present study used within-session transitions between two concurrent schedules to evaluate choice in transition. Eight female Long-Evans rats were trained to respond under concurrent schedules of reinforcement during experimental sessions that lasted 22 hr. The generalized matching equation was used to model steady-state behavior at the end of each session, while transitional behavior that emerged following the change in reinforcement schedules was modeled using a logistic equation. The generalized matching and logistic equations were appropriate models for behavior generated during single-session transitions. A local analysis of behavior on the two response alternatives during acquisition was used to determine the source of preference as revealed in response ratios. The number of "low-response" visits, those containing three to five responses, remained stable. Preference ratios largely reflected a sharp increase in the number of visits with long response bouts on the rich alternative and a decrease in the number of such visits to the leaner alternative.

Keywords: acquisition; choice; concurrent schedules; lever press, rats; transitions.


Figures

Fig 1
Fig 1
Representative 32:1 transition (from subject 102). Log response ratio is plotted as a function of cumulative reinforcers earned. Data points are LOWESS smoothed values and the function was fitted by Equation 2. The vertical line indicates the beginning of the transition (x  =  0). Negative values of x are reinforcers delivered prior to the transition. This transition had a magnitude of 0.62, the half-maximal reinforcers value was 19.02, and the slope at the inflection point was 0.23. The last term indicates that the middle 1/e (∼1/2.7) of the transition was 1/0.23 or 4.3 reinforcers in length. BL  =  baseline.
Fig 2
Fig 2
Response and changeover rates as a function of session segment and transition magnitude. Error bars are ± 1 standard error of the mean (SEM). BL  =  baseline, TR  =  transition, END  =  last 30 min of session.
Fig 3
Fig 3
Matching functions for individual animals. Matching equations and variance accounted for are provided in the lower right hand corner of each figure. Dashed diagonal line represents strict matching (i.e., B1/B2  =  R1/R2).
Fig 4
Fig 4
Sample transitions for 4 animals at 4:1, 8:1, 16:1, and 32:1 magnitudes, reading from the left to the right columns. Each row represents a different subject. Data points are those calculated by the 9-point LOWESS smoothing algorithm. The curves are the best-fitting functions generated with the logistic equation.
Fig 5
Fig 5
Sample transitions for the other 4 animals at 4:1, 8:1, 16:1, and 32:1 magnitudes, reading from the left to the right columns. Each row represents a different subject. Data points are those calculated by the 9-point LOWESS smoothing algorithm. The curves are the best-fitting functions generated with the logistic equation.
Fig 6
Fig 6
Average Xhalf, slope, and Ym as a function of transition magnitude. Closed symbols represent group means, and error bars are ± 1 SEM. Open symbols are parameters from individual matching functions. *Data from the 4:1 transitions are not included in statistical analyses.
Fig 7
Fig 7
Frequency distributions of responses per visit for a single subject (Rat 105) during three different transitions. The magnitude of the transition is shown above each pair of columns. The left and right columns show frequency distributions for responses on the lean and rich alternatives, respectively. The top row shows histograms from the first 30 min of a session during which the programmed ratio of reinforcers for each alternative was 1∶1. The second row shows frequency distributions during the transition period (30 – 90 min.), at which point the programmed ratios changed from 1∶1 to 1∶4, 1∶16, or 1∶32. The bottom panel shows data from the last 30 min of a session. The geometric mean and standard deviation for each distribution are given in parentheses. Distributions exclude responses that occurred during the changeover delays.
Fig 8
Fig 8
Average and modal response rate as a function of transition magnitude and session segment. Means and modes are presented in the top and bottom panels, respectively. Error bars are ± 1 SEM. Closed symbols  =  rich lever, open symbols  =  lean lever, BL  =  baseline, TR  =  transition, END  =  last 30 minutes of session.

References

    1. Alsop B, Elliffe D. Concurrent-schedule performance: Effects of relative and overall reinforcer rates. Journal of the Experimental Analysis of Behavior. 1988;49:21–36. - PMC - PubMed
    1. Bailey J, Mazur J. Choice behavior in transition: Development of preference for the higher probability of reinforcement. Journal of the Experimental Analysis of Behavior. 1990;53:409–422. - PMC - PubMed
    1. Baum W. On two types of deviation from the matching law: Bias and undermatching. Journal of the Experimental Analysis of Behavior. 1974;22(1):231–242. - PMC - PubMed
    1. Baum W. Matching, undermatching and overmatching in studies of choice. Journal of the Experimental Analysis of Behavior. 1979;32:269–281. - PMC - PubMed
    1. Cleveland W.S. Robust locally weighted regression and smoothing scatterplots. Journal of the American Statistical Association. 1979;74:829–836.

LinkOut - more resources