

Trabecular morphometry by fractal signature analysis is a novel marker of osteoarthritis progression
- PMID: 19950282
- PMCID: PMC3711179
- DOI: 10.1002/art.25012
Trabecular morphometry by fractal signature analysis is a novel marker of osteoarthritis progression
Abstract
Objective: To evaluate the effectiveness of using subchondral bone texture observed on a radiograph taken at baseline to predict progression of knee osteoarthritis (OA) over a 3-year period.
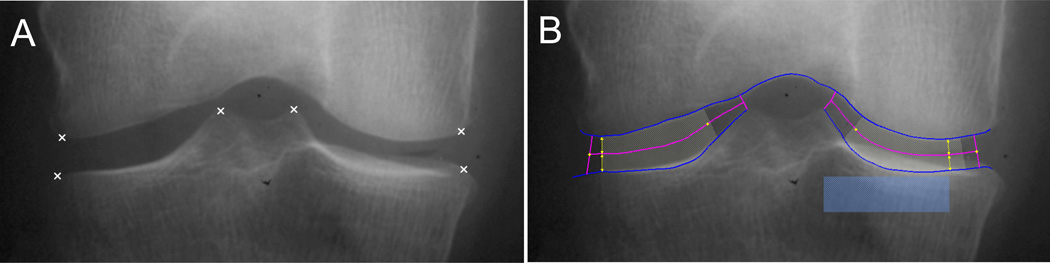
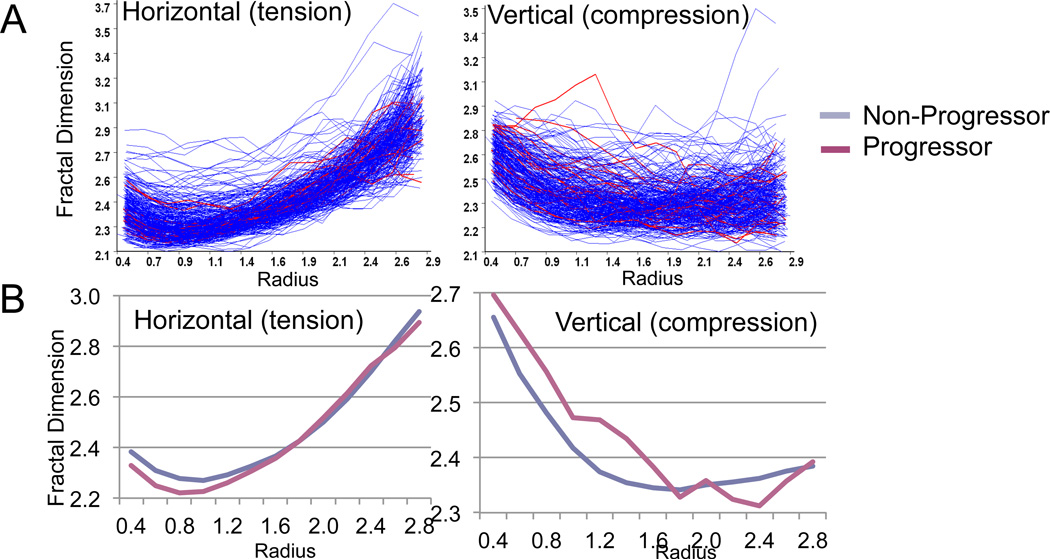
Methods: A total of 138 participants in the Prediction of Osteoarthritis Progression study were evaluated at baseline and after 3 years. Fractal signature analysis (FSA) of the medial subchondral tibial plateau was performed on fixed flexion radiographs of 248 nonreplaced knees, using a commercially available software tool. OA progression was defined as a change in joint space narrowing (JSN) or osteophyte formation of 1 grade according to a standardized knee atlas. Statistical analysis of fractal signatures was performed using a new model based on correlating the overall shape of a fractal dimension curve with radius.
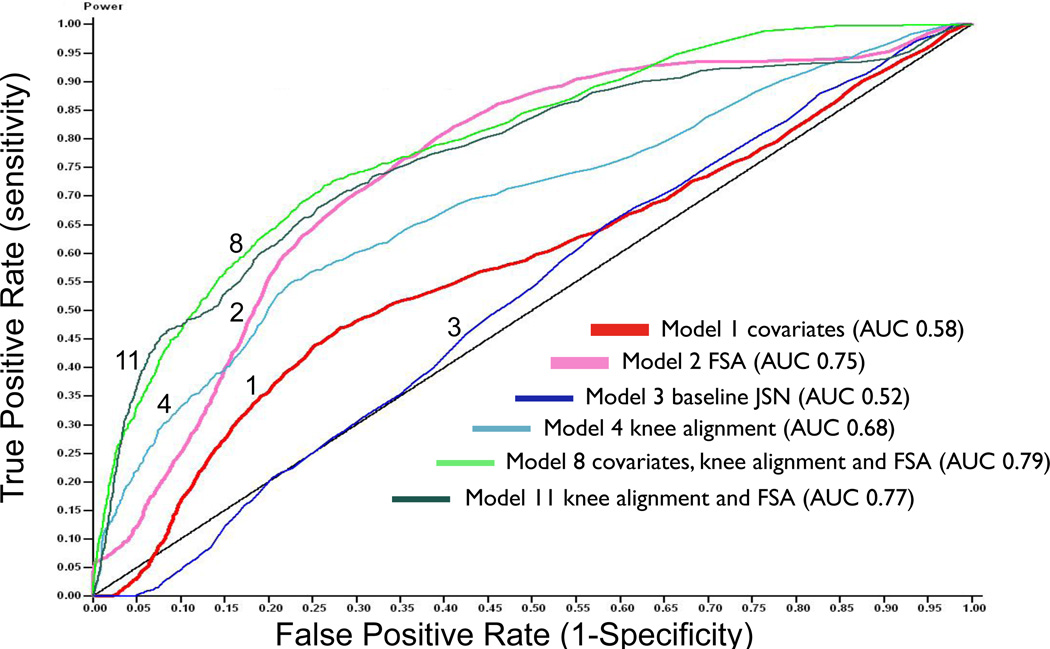
Results: Fractal signature of the medial tibial plateau at baseline was predictive of medial knee JSN progression (area under the curve [AUC] 0.75, of a receiver operating characteristic curve) but was not predictive of osteophyte formation or progression of JSN in the lateral compartment. Traditional covariates (age, sex, body mass index, knee pain), general bone mineral content, and joint space width at baseline were no more effective than random variables for predicting OA progression (AUC 0.52-0.58). The predictive model with maximum effectiveness combined fractal signature at baseline, knee alignment, traditional covariates, and bone mineral content (AUC 0.79).
Conclusion: We identified a prognostic marker of OA that is readily extracted from a plain radiograph using FSA. Although the method needs to be validated in a second cohort, our results indicate that the global shape approach to analyzing these data is a potentially efficient means of identifying individuals at risk of knee OA progression.
Figures
References
-
- Hunter DJ, Zhang YQ, Tu X, Lavalley M, Niu JB, Amin S, et al. Change in joint space width: hyaline articular cartilage loss or alteration in meniscus? Arthritis Rheum. 2006;54(8):2488–2495. - PubMed
-
- Brandt KD, Mazzuca SA, Katz BP, Lane KA, Buckwalter KA, Yocum DE, et al. Effects of doxycycline on progression of osteoarthritis: results of a randomized, placebo-controlled, double-blind trial. Arthritis Rheum. 2005;52(7):2015–2025. - PubMed
-
- Hellio Le Graverand MP, Buck RJ, Wyman BT, Vignon E, Mazzuca SA, Brandt KD, et al. Change in regional cartilage morphology and joint space width in osteoarthritis participants versus healthy controls - a multicenter study using 3.0 Tesla MRI and Lyon Schuss radiography. Ann Rheum Dis. 2008 - PubMed
-
- Lohmander LS, Felson D. Can we identify a 'high risk' patient profile to determine who will experience rapid progression of osteoarthritis? Osteoarthritis Cartilage. 2004;12(Suppl A):S49–S52. - PubMed
-
- Goldring SR. The role of bone in osteoarthritis pathogenesis. Rheum Dis Clin North Am. 2008;34(3):561–571. - PubMed
Publication types
MeSH terms
Grants and funding
LinkOut - more resources
Full Text Sources
Other Literature Sources
Medical
