

Voriconazole pharmacokinetics and pharmacodynamics in children
- PMID: 19951112
- PMCID: PMC2803104
- DOI: 10.1086/648679
Voriconazole pharmacokinetics and pharmacodynamics in children
Abstract
Background: Voriconazole pharmacokinetic and pharmacodynamic data are lacking in children.
Methods: Records at the Childrens Hospital Los Angeles were reviewed for children with > or =1 serum voriconazole concentration measured from 1 May 2006 through 1 June 2007. Information on demographic characteristics, dosing histories, serum concentrations, toxicity and survival, and outcomes was obtained.
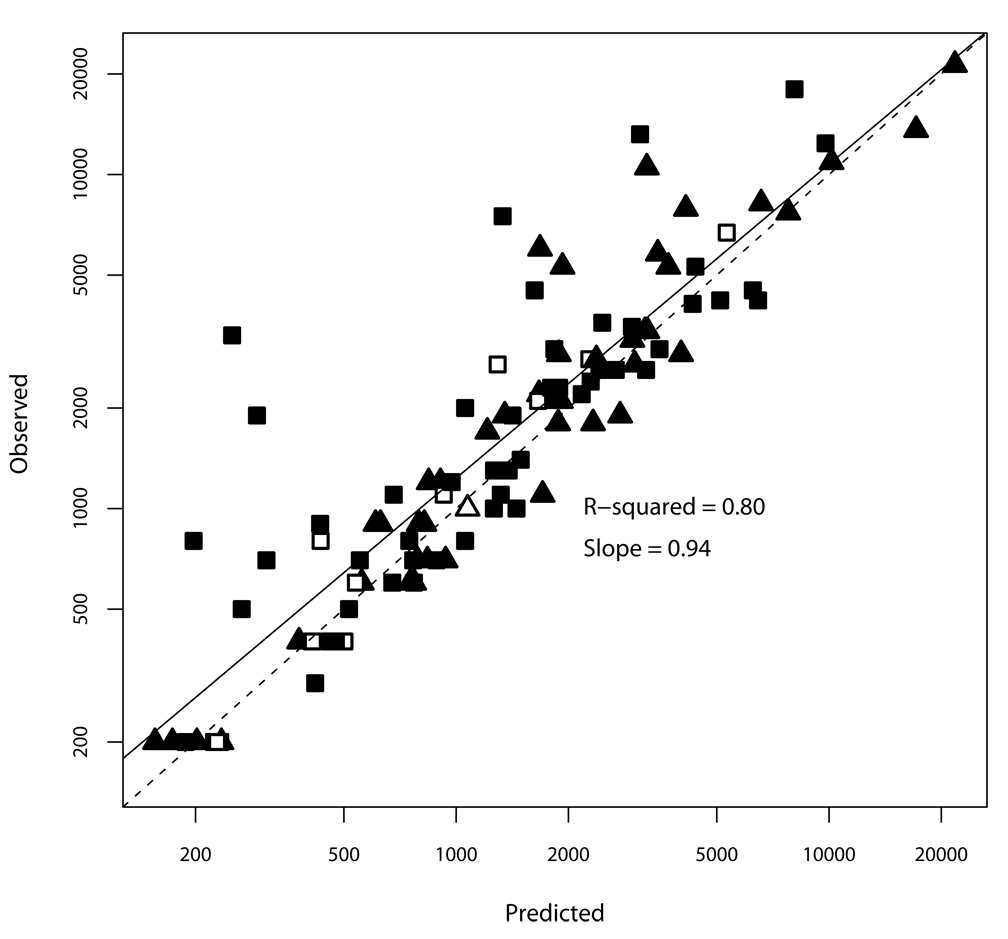
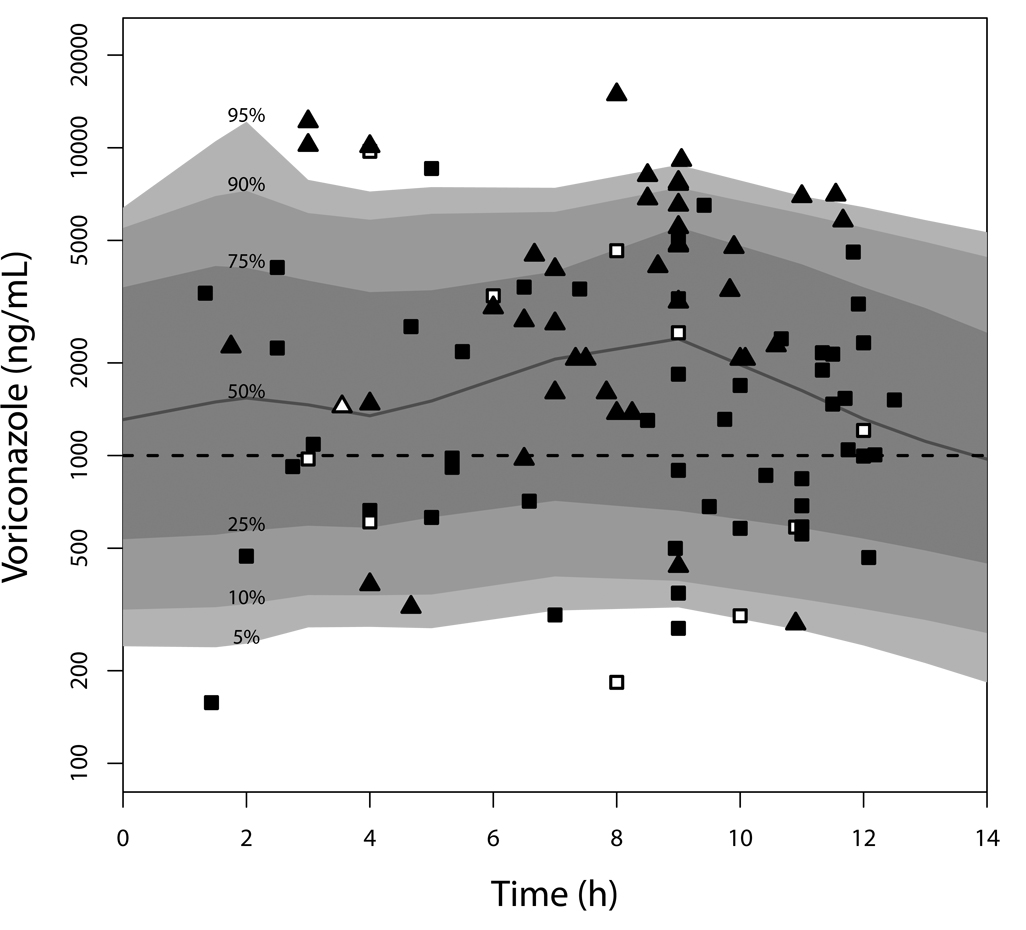
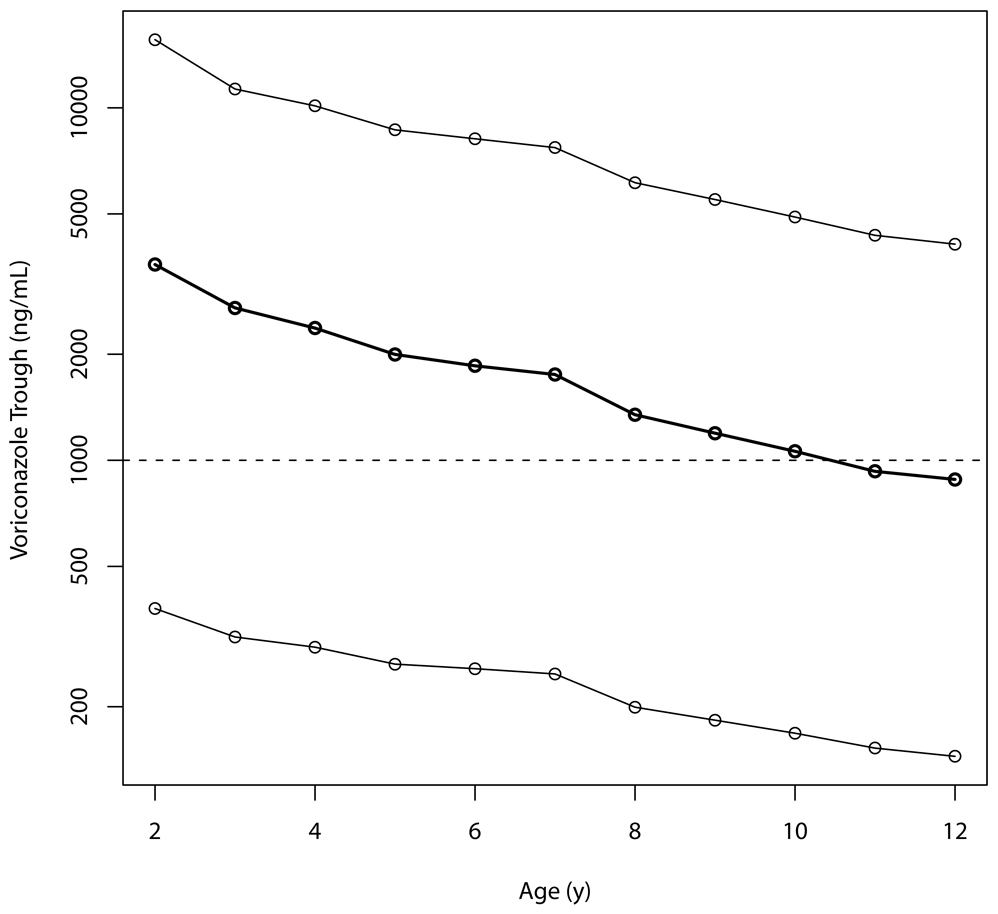
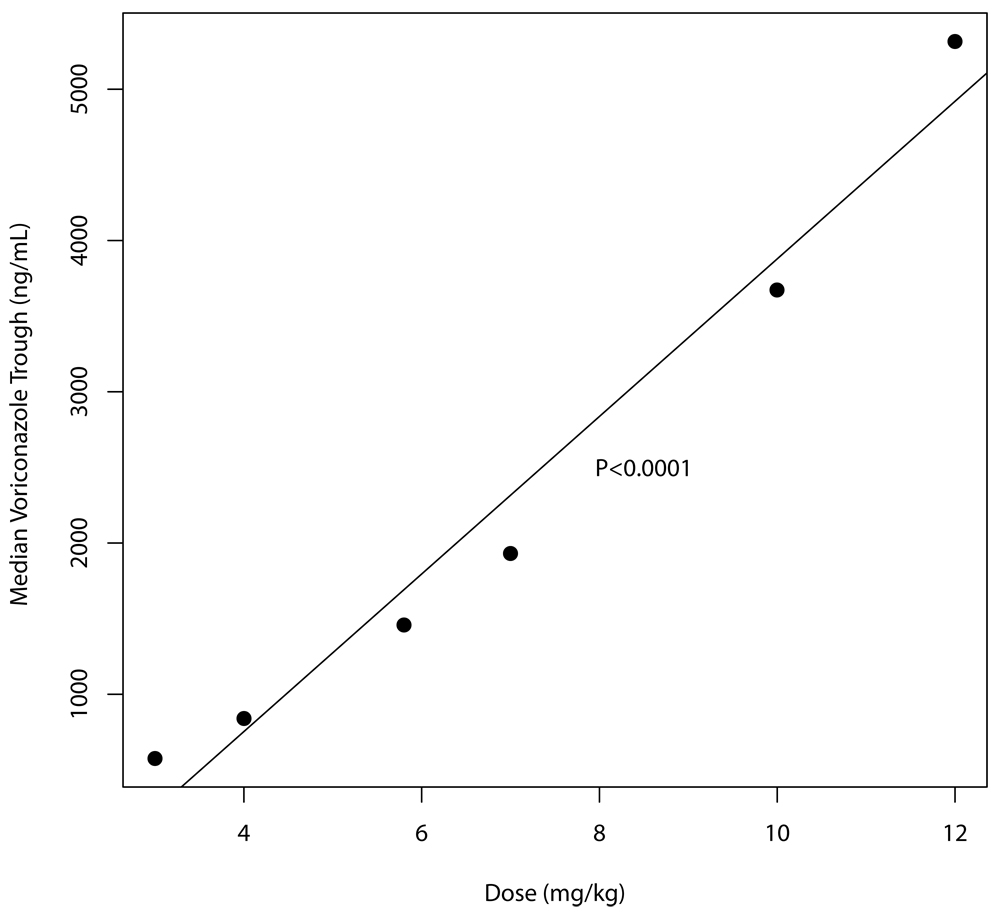
Results: A total of 207 voriconazole measurements were obtained from 46 patients (age, 0.8-20.5 years). A 2-compartment Michaelis-Menten pharmacokinetic model fit the data best but explained only 80% of the observed variability. The crude mortality rate was 28%, and each trough serum voriconazole concentration <1000 ng/mL was associated with a 2.6-fold increased odds of death (95% confidence interval, 1.6-4.8; P=.002). Serum voriconazole concentrations were not associated with hepatotoxicity. Simulations predicted an intravenous dose of 7 mg/kg or an oral dose of 200 mg twice daily would achieve a trough >1000 ng/mL in most patients, but with a wide range of possible concentrations.
Conclusions: We found a pharmacodynamic association between a voriconazole trough >1000 ng/mL and survival and marked pharmacokinetic variability, particularly after enteral dosing, justifying the measurement of serum concentrations.
Figures
Comment in
-
How many steps along the path is too far?Clin Infect Dis. 2010 Jan 1;50(1):37-9. doi: 10.1086/648680. Clin Infect Dis. 2010. PMID: 19951111 No abstract available.
-
Oral voriconazole dose in children: one size does not fit all.Clin Infect Dis. 2010 Oct 1;51(7):870; author reply 871. doi: 10.1086/656293. Clin Infect Dis. 2010. PMID: 20809842 No abstract available.
Similar articles
-
Therapeutic drug monitoring of voriconazole after intravenous administration in infants and children with primary immunodeficiency.Ther Drug Monit. 2011 Aug;33(4):464-6. doi: 10.1097/FTD.0b013e3182241b2b. Ther Drug Monit. 2011. PMID: 21743382
-
Voriconazole pharmacokinetics and safety in immunocompromised children compared to adult patients.Antimicrob Agents Chemother. 2010 Aug;54(8):3225-32. doi: 10.1128/AAC.01731-09. Epub 2010 Jun 14. Antimicrob Agents Chemother. 2010. PMID: 20547816 Free PMC article. Clinical Trial.
-
Voriconazole drug monitoring in the management of invasive fungal infection in immunocompromised children: a prospective study.J Antimicrob Chemother. 2012 Mar;67(3):700-6. doi: 10.1093/jac/dkr517. Epub 2011 Dec 21. J Antimicrob Chemother. 2012. PMID: 22190607
-
Pharmacokinetic/pharmacodynamic profile of voriconazole.Clin Pharmacokinet. 2006;45(7):649-63. doi: 10.2165/00003088-200645070-00002. Clin Pharmacokinet. 2006. PMID: 16802848 Review.
-
Clinical application of voriconazole concentrations in the treatment of invasive aspergillosis.Ann Pharmacother. 2008 Dec;42(12):1859-64. doi: 10.1345/aph.1L243. Epub 2008 Nov 18. Ann Pharmacother. 2008. PMID: 19017830 Review.
Cited by
-
Practice guidelines for therapeutic drug monitoring of voriconazole: a consensus review of the Japanese Society of Chemotherapy and the Japanese Society of Therapeutic Drug Monitoring.J Infect Chemother. 2013 Jun;19(3):381-92. doi: 10.1007/s10156-013-0607-8. Epub 2013 May 15. J Infect Chemother. 2013. PMID: 23673473 Free PMC article. No abstract available.
-
Therapeutic drug monitoring for triazoles: A needs assessment review and recommendations from a Canadian perspective.Can J Infect Dis Med Microbiol. 2014 Nov-Dec;25(6):327-43. doi: 10.1155/2014/340586. Can J Infect Dis Med Microbiol. 2014. PMID: 25587296 Free PMC article. Review.
-
Rapid Quantitative Detection of Voriconazole in Human Plasma Using Surface-Enhanced Raman Scattering.ACS Omega. 2022 Dec 15;7(51):47634-47641. doi: 10.1021/acsomega.2c04521. eCollection 2022 Dec 27. ACS Omega. 2022. PMID: 36591153 Free PMC article.
-
Potency and Preclinical Evidence of Synergy of Oral Azole Drugs and Miltefosine in an Ex Vivo Model of Leishmania (Viannia) panamensis Infection.Antimicrob Agents Chemother. 2022 Jan 18;66(1):e0142521. doi: 10.1128/AAC.01425-21. Epub 2021 Oct 25. Antimicrob Agents Chemother. 2022. PMID: 34694879 Free PMC article.
-
Therapeutic drug monitoring in voriconazole-associated hyponatremia.Med Mycol Case Rep. 2013 Jun 19;2:134-6. doi: 10.1016/j.mmcr.2013.06.003. eCollection 2013 Jun 19. Med Mycol Case Rep. 2013. PMID: 24432238 Free PMC article.
References
-
- Herbrecht R, Denning DW, Patterson TF, et al. Voriconazole versus amphotericin B for primary therapy of invasive aspergillosis. N Engl J Med. 2002;347(6):408–415. - PubMed
-
- Denning DW, Ribaud P, Milpied N, et al. Efficacy and safety of voriconazole in the treatment of acute invasive aspergillosis. Clin Infect Dis. 2002;34(5):563–571. - PubMed
