. 2010 Jan 1;50(1):98-105.
doi: 10.1086/648729.

Improved virological outcomes in British Columbia concomitant with decreasing incidence of HIV type 1 drug resistance detection

Affiliations

Improved virological outcomes in British Columbia concomitant with decreasing incidence of HIV type 1 drug resistance detection

Vikram S Gill et al. Clin Infect Dis. .

Abstract

Background: There have been limited studies evaluating temporal changes in the incidence of detection of drug resistance among human immunodeficiency virus type 1 (HIV-1) isolates and concomitant changes in plasma HIV load for treated individuals in a population-wide setting.

Methods: Longitudinal plasma viral load and genotypic resistance data were obtained from patients receiving antiretroviral therapy from the British Columbia Drug Treatment Program from July 1996 through December 2008. A total of 24,652 resistance tests were available from 5422 individuals. The incidence of successful plasma viral load suppression and of resistance to each of 3 antiretroviral categories (nucleoside/nucleotide reverse-transcriptase inhibitors, nonnucleoside reverse transcriptase inhibitors, and protease inhibitors) was calculated for the population receiving therapy.

Results: There has been a drastic decrease in the incidence of new cases of HIV-1 drug resistance in individuals followed during 1996-2008. In 1997, the incidence rate of any newly detected resistance was 1.73 cases per 100 person-months of therapy, and by 2008, the incidence rate had decreased >12-fold, to 0.13 cases per 100 person-months of therapy. This decrease in the incidence of resistance has occurred at an exponential rate, with half-times on the order of 2-3 years. Concomitantly, the proportion of individuals with plasma viral load suppression has increased linearly over time (from 64.7% with HIV RNA levels <50 copies/mL in 2000 to 87.0% in 2008; R2=0.97; P<.001).

Conclusions: Our results suggest an increasing effectiveness of highly active antiretroviral therapy at the populational level. The vast majority of treated patients in British Columbia now have either suppressed plasma viral load or drug-susceptible HIV-1, according to their most recent test results.


Conflict of interest statement

Potential conflicts of interest. P.R.H. has received grants from, has served as an ad hoc advisor to, or has spoken at various events sponsored by Pfizer, GlaxoSmithKline, Abbott, Merck, Virco, and Monogram and has consulted for and/or received grant funding from a variety of pharmaceutical diagnostic companies, none of which are mentioned in this article, nor are their products or services discussed. J.S.G.M. has received grants from, has served as an ad hoc advisor to, or has spoken at various events sponsored by Abbott, Argos, Therapeutics, Bioject, Boehringer Ingelheim, BMS, Gilead Sciences, GlaxoSmithKline, Hoffmann-La Roche, Janssen-Or-tho, Merck Frosst, Panacos, Pfizer, Schering, Serono, TheraTechnologies, Tibotec, and Trimeris. All other authors: no conflicts.

Figures

Figure 1
Figure 1
Annual incidence rate of drug resistance detected for any antiretroviral category and for individual drug classes. A, Annual incidence rates of resistance to any antiretroviral. B, Annual incidence rates of resistance to nucleoside reverse-transcriptase inhibitors (NRTIs) (triangles), nonnucleoside reverse-transcriptase inhibitors (NNRTIs) (diamonds), and protease inhibitors (PIs) (circles). Incidence rates are natural-log (ln) transformed. Dashed and solid lines represent corresponding linear regressions. The number of patients receiving antiretroviral therapy, the number of patients tested for resistance, the number of samples genotyped, and the number of patients with at least 1 plasma viral load (pVL) ≥250 copies/mL in each year is indicated below the graphs.
Figure 2
Figure 2
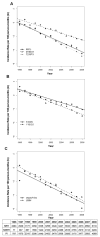
Annual incidence rate of drug resistance detected for the most commonly occurring mutations in human immunodeficiency virus type 1 (HIV-1) protease and reverse transcriptase, as a function of calendar year. A, Incidence rate for the major nucleoside reverse-transcriptase inhibitor (NRTI) resistance mutations M41L, M184V/I, and T215F/Y. B, Incidence rate for the major nonnucleoside reverse-transcriptase inhibitor (NNRTI) resistance mutations K103N and Y181C/I. C, Incidence rate for the major protease inhibitor (PI) resistance mutations V82A/F/T/S and L90M. Incidence rates are natural-log (ln) transformed. Dashed and solid lines represent corresponding linear regressions. The number of people exposed to each therapy, by calendar year, is indicated below the graphs.
Figure 3
Figure 3
Distribution of the lowest (A) and highest (B) plasma viral loads (pVLs) for human immunodeficiency virus type 1 (HIV-1) and the percentage of individuals achieving a plasma HIV-1 RNA level below the limit of detection of the RNA assay (C), for all patients in British Columbia. The box plot includes the median (solid horizontal bar), interquartile range (box), and the lower of 1.5 times the interquartile range or the most extreme value (dashed line). The number of patients who received therapy within a given year and had an available pVL test is indicated above the bars. These data include patients who recently started antiretrovirals. Note that the reporting of pVL values is capped at the limits of the pVL assay. The lower limit of the viral load assay was changed in 1999. Therefore, the newer assay would report lower values for the lower quartile and 1.5 times the interquartile range for pVL values in 1996–1998. Except for 1998, median values could not be affected, but interquartile range values could be affected. For the percentage of individuals achieving a plasma HIV-1 RNA level below the limit of detection, data are shown from the year 2000 onward because of the decrease of the lower limit of the viral load assay from 500 to 50 copies/mL in April 1999. Annual percentages were based upon the lowest available pVL from individuals, regardless of whether they were receiving therapy at the time of testing.
Figure 4
Figure 4
The annual incidence rate of drug resistance detected for any antiretroviral category (A) and for individual drug classes of nucleoside reverse-transcriptase inhibitors (NRTIs) (B), nonnucleoside reverse-transcriptase inhibitors (NNRTIs) (C), and protease inhibitors (PIs) (D), stratified by period of therapy initiation (1987–1995, 1996–1999, 2000–2004, or 2005–2008). Incidence rates are natural-log (ln) transformed. Dashed and solid lines represent corresponding linear regressions.

References

    1. Hogg RS, Yip B, Kully C, et al. Improved survival among HIV-infected patients after initiation of triple-drug antiretroviral regimens. CMAJ. 1999;160:659–65. - PMC - PubMed
    1. Palella FJ, Jr, Delaney KM, Moorman AC, et al. Declining morbidity and mortality among patients with advanced human immunodeficiency virus infection. HIV Outpatient Study Investigators. N Engl J Med. 1998;338:853–60. - PubMed
    1. Santoro MM, Ciccozzi M, Alteri C, et al. Characterization of drug-resistance mutations in HIV type 1 isolates from drug-naive and ARV-treated patients in Bulgaria. AIDS Res Hum Retroviruses. 2008;24:1133–8. - PMC - PubMed
    1. Panos G, Charatsis G, Paparizos V, Kazantzi M, Falagas ME. Prevalence of genotypic resistance to nucleoside analogues, nonnucleoside analogues, and protease inhibitors in HIV-infected persons in Athens, Greece. AIDS Res Hum Retroviruses. 2008;24:43–51. - PubMed
    1. Escoto-Delgadillo M, Vazquez-Valls E, Ramirez-Rodriguez M, et al. Drug-resistance mutations in antiretroviral-naive patients with established HIV-1 infection in Mexico. HIV Med. 2005;6:403–9. - PubMed

Publication types