

Characterization of tissue oxygen saturation and the vascular occlusion test: influence of measurement sites, probe sizes and deflation thresholds
- PMID: 19951387
- PMCID: PMC2786105
- DOI: 10.1186/cc8001
Characterization of tissue oxygen saturation and the vascular occlusion test: influence of measurement sites, probe sizes and deflation thresholds
Abstract
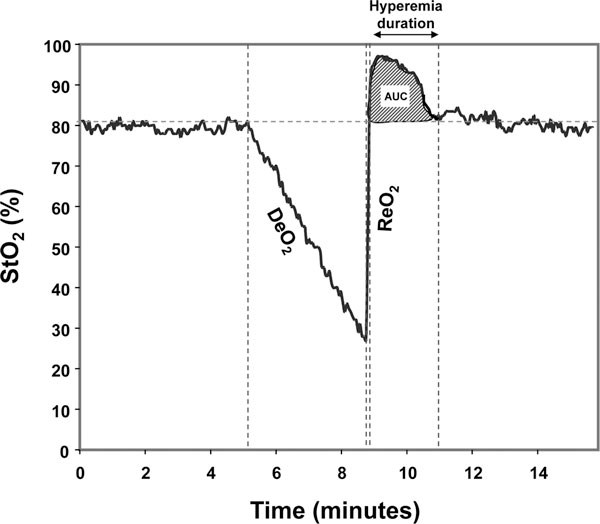
Introduction: Tissue oxygen saturation (StO2) and the vascular occlusion test (VOT) can identify tissue hypoperfusion in trauma and sepsis. However, the technique is neither standardized nor uses the same monitoring site. We hypothesized that baseline and VOT StO2 would be different in the forearm (F) and thenar eminence (TH) and that different minimal StO2 values during the VOT would result in different reoxygenation rates (ReO2).
Methods: StO2 and its change during the VOT were simultaneously measured in the F and TH, with 15 mm and 25 mm probes, using the 325 InSpectra monitor in 18 healthy, adult volunteers. Two VOTs were done to a threshold thenar StO2 of 40% interchanging the 15 mm and 25 mm probes between sites. Two additional VOTs were done to thresholds of 50% and 30%. Baseline StO2 (BaseO2), the deoxygenation rate (DeO2) and ReO2 were compared between sites, probes and (%O2/minute) thresholds. Results are presented as the median (interquartile range), P-value.
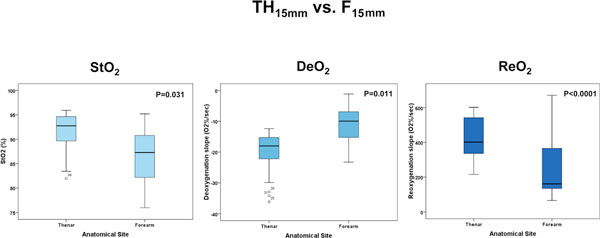
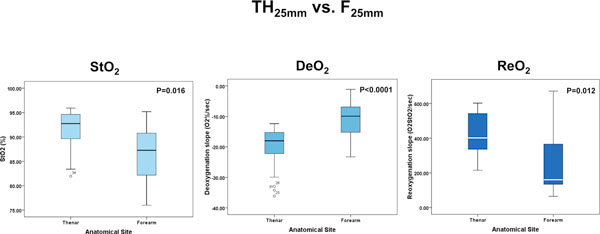
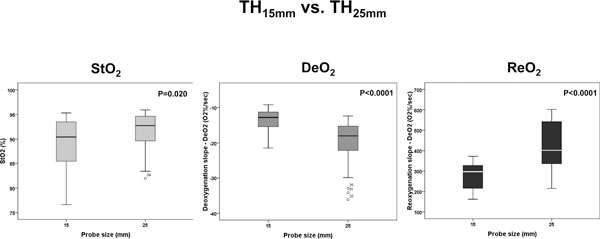
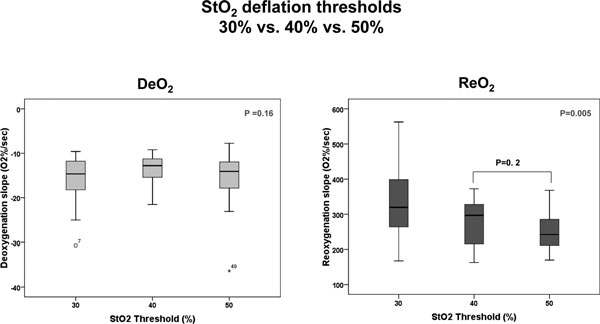
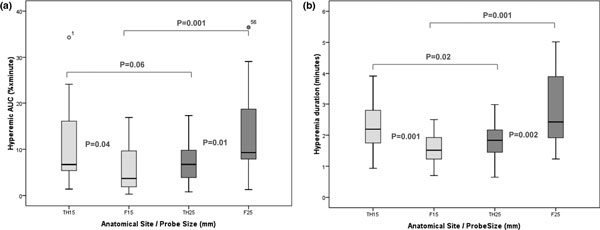
Results: BaseO2, DeO2, ReO2, area under the curve and hyperemia duration values were different when comparing TH vs. F and 15 mm vs. 25 mm probes. ReO2 was different between different thresholds for the TH and 15 mm probes. TH15 mm vs. F15 mm: BaseO2, 90.4 (85.2, 93.5) vs. 85.2 (80.7, 90.2), P = 0.031; DO2, -12.1 (-16.2, -11.3) vs. -8.5 (-10.3, -7.8), P = 0.011; ReO2, 297.2 (213.7, 328.6), P < 0.0001; 15 mm vs. 25 mm probe: BaseO2, 97.2 (89.4, 94.7) vs. 87.3 (81.7, 90.9), P = 0.016; DeO2, -18.0 (-24.1, -14.8) vs. -9.9 (-15.3, -6.5), P < 0.0001; and ReO2, 401.6 (331.7, 543.2) vs. 160.5 (132.3, 366.9), P = 0.012, respectively. TH15 mm vs. TH25 mm: BaseO2, P = 0.020; DeO2, P < 0.0001; and ReO2, P < 0.0001. Threshold StO2 values (15 mm probe only): ReO2, P = 0.003; DeO2, P = 0.60. ReO2 at 40% and 50% StO2 thresholds, P = 0.01.
Conclusions: BaseO2, DeO2 and ReO2 were different when measured in different anatomical sites (F and TH) and with different probe sizes, and ReO2 was different with differing VOT release StO2 threshold values. Thus, standardization of the site, probe and VOT challenge need to be stipulated when reporting data.
Figures
References
-
- Crookes BA, Cohn SM, Bloch S, Amortegui J, Manning R, Li P, Proctor MS, Hallal A, Blackbourne LH, Benjamin R, Soffer D, Habib F, Schulman CI, Duncan R, Proctor KG. Can near-infrared spectroscopy identify the severity of shock in trauma patients? J Trauma. 2005;58:806–813. doi: 10.1097/01.TA.0000158269.68409.1C. discussion 813-816. - DOI - PubMed
Publication types
MeSH terms
Grants and funding
LinkOut - more resources
Full Text Sources
Medical
