. 2009 Oct;4(1):2-20.
doi: 10.1186/1479-7364-4-1-2.

Genetic association tests: a method for the joint analysis of family and case-control data

Affiliations

Genetic association tests: a method for the joint analysis of family and case-control data

Courtney Gray-McGuire et al. Hum Genomics. 2009 Oct.

Abstract

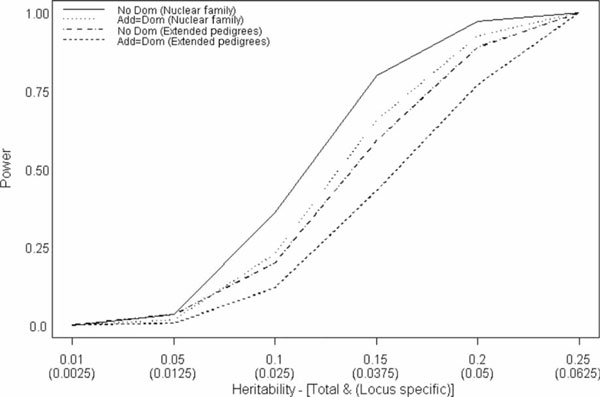
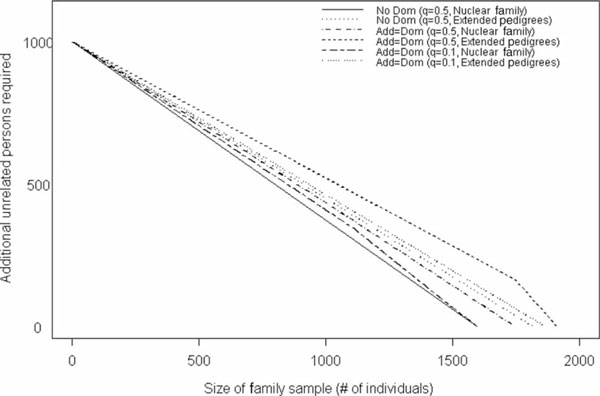
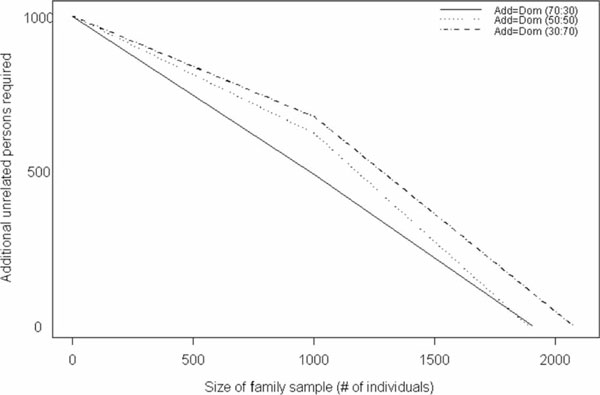
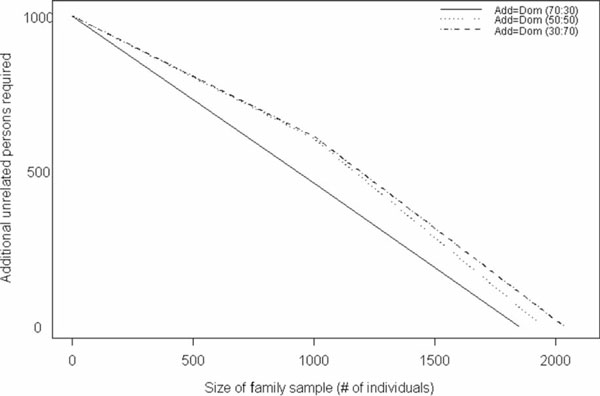
With the trend in molecular epidemiology towards both genome-wide association studies and complex modelling, the need for large sample sizes to detect small effects and to allow for the estimation of many parameters within a model continues to increase. Unfortunately, most methods of association analysis have been restricted to either a family-based or a case-control design, resulting in the lack of synthesis of data from multiple studies. Transmission disequilibrium-type methods for detecting linkage disequilibrium from family data were developed as an effective way of preventing the detection of association due to population stratification. Because these methods condition on parental genotype, however, they have precluded the joint analysis of family and case-control data, although methods for case-control data may not protect against population stratification and do not allow for familial correlations. We present here an extension of a family-based association analysis method for continuous traits that will simultaneously test for, and if necessary control for, population stratification. We further extend this method to analyse binary traits (and therefore family and case-control data together) and accurately to estimate genetic effects in the population, even when using an ascertained family sample. Finally, we present the power of this binary extension for both family-only and joint family and case-control data, and demonstrate the accuracy of the association parameter and variance components in an ascertained family sample.


Figures

Figure 1
Figure 1
Power to detect association by both total and locus-specific heritability for nuclear families (nuc fam) under an additive model (No Dom) and a model with 50 per cent additive and 50 per cent dominance variance (Add = Dom).
Figure 2
Figure 2
Number of unrelated case-control samples needed, in addition to a fixed sample of either nuclear or extended pedigrees, to achieve a power of 92 per cent under an additive model (No Dom) and 86 per cent under a model with 50 per cent additive and 50 per cent dominance variance (Add = Dom). Values were generated for fixed sample sizes of both nuclear families and extended pedigrees, as well as for allele frequencies of both 0.5 and 0.1.
Figure 3
Figure 3
Number of unrelated case-control samples needed, in addition to a fixed, mixed sample of nuclear and extended pedigrees, to achieve a power of 86 per cent under a model with 50 per cent additive and 50 per cent dominance variance (Add = Dom), assuming an allele frequency of 0.5. Values were generated for samples that comprised 30 per cent nuclear families and 70 per cent extended pedigrees, 50 per cent and 50 per cent, and 30 per cent and 70 per cent, respectively.
Figure 4
Figure 4
Number of unrelated case-control samples needed, in addition to a fixed, mixed sample of nuclear and extended pedigrees, to achieve a power of 86 per cent under a model with 50 per cent additive and 50 per cent dominance variance (Add = Dom), assuming an allele frequency of 0.1. Values were generated for samples that comprised 30 per cent nuclear families and 70 per cent extended pedigrees, 50 per cent and 50 per cent, and 30 per cent and 70 per cent, respectively.
Figure 5
Figure 5
Number of unrelated case-control samples needed, in addition to a fixed, mixed sample of nuclear and extended pedigrees, to achieve a power of 92 per cent under as additive model (No Dom), assuming an allele frequency of 0.1. Values were generated for samples that comprised 30 per cent nuclear families and 70 per cent extended pedigrees, 50 per cent and 50 per cent, and 30 per cent and 70 per cent, respectively.

References

    1. Cordell HJ. 'Sample size requirements to control for stochastic variation in magnitude and location of allele-sharing linkage statistics in affected sibling pairs'. Ann Hum Genet. 2001;65:491–502. doi: 10.1046/j.1469-1809.2001.6550491.x. - DOI - PubMed
    1. Visscher PM, Andrew T, Nyholt DR. 'Genome-wide association studies of quantitative traits with related individuals: Little (power) lost but much to be gained'. Eur J Hum Genet. 2008;16:387–390. doi: 10.1038/sj.ejhg.5201990. - DOI - PubMed
    1. Altshuler D, Clark AG. 'Genetics. Harvesting medical information from the human family tree'. Science. 2005;307:1052–1053. doi: 10.1126/science.1109682. - DOI - PubMed
    1. Elston RC. 'Linkage and association to genetic markers'. Exp Clin Immunogenet. 1995;12:129–140. - PubMed
    1. Knowler WC, Williams RC, Pettitt DJ, Steinberg AG. 'Gm3;5,13,14 and type 2 diabetes mellitus: An association in American Indians with genetic admixture'. Am J Hum Genet. 1988;43:520–526. - PMC - PubMed

Publication types