. 2010 Jun;59(6):775-84.
doi: 10.1136/gut.2009.181834. Epub 2009 Dec 1.

MicroRNA-29a regulates intestinal membrane permeability in patients with irritable bowel syndrome

Affiliations

MicroRNA-29a regulates intestinal membrane permeability in patients with irritable bowel syndrome

QiQi Zhou et al. Gut. 2010 Jun.

Abstract

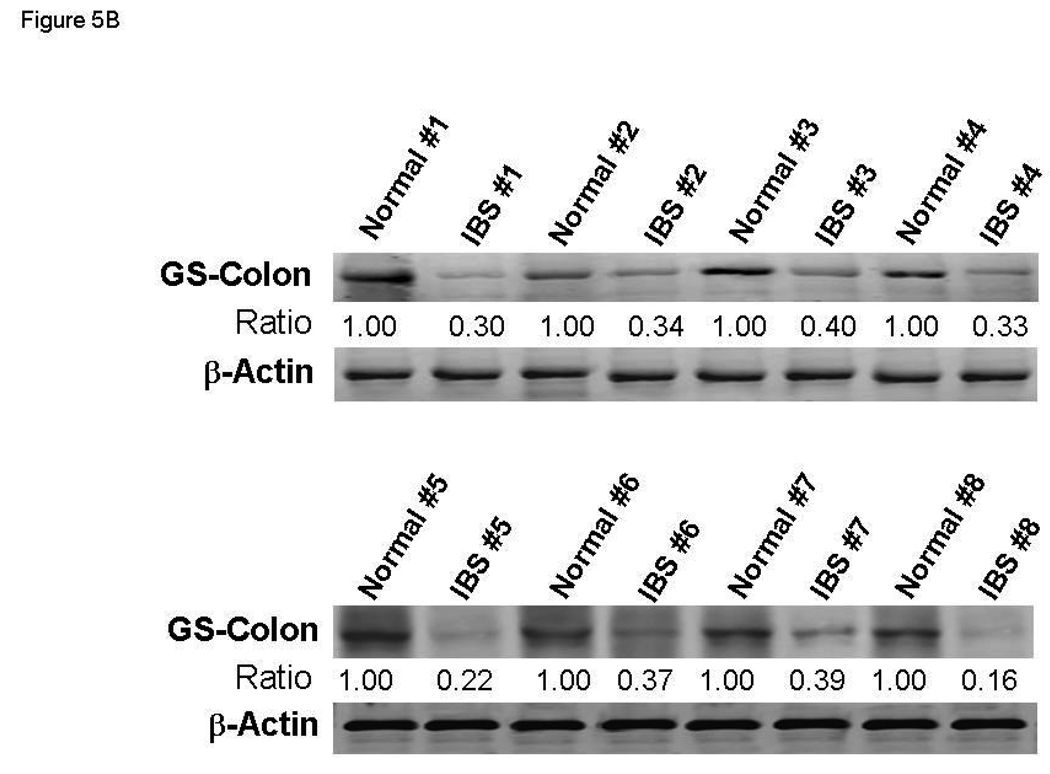
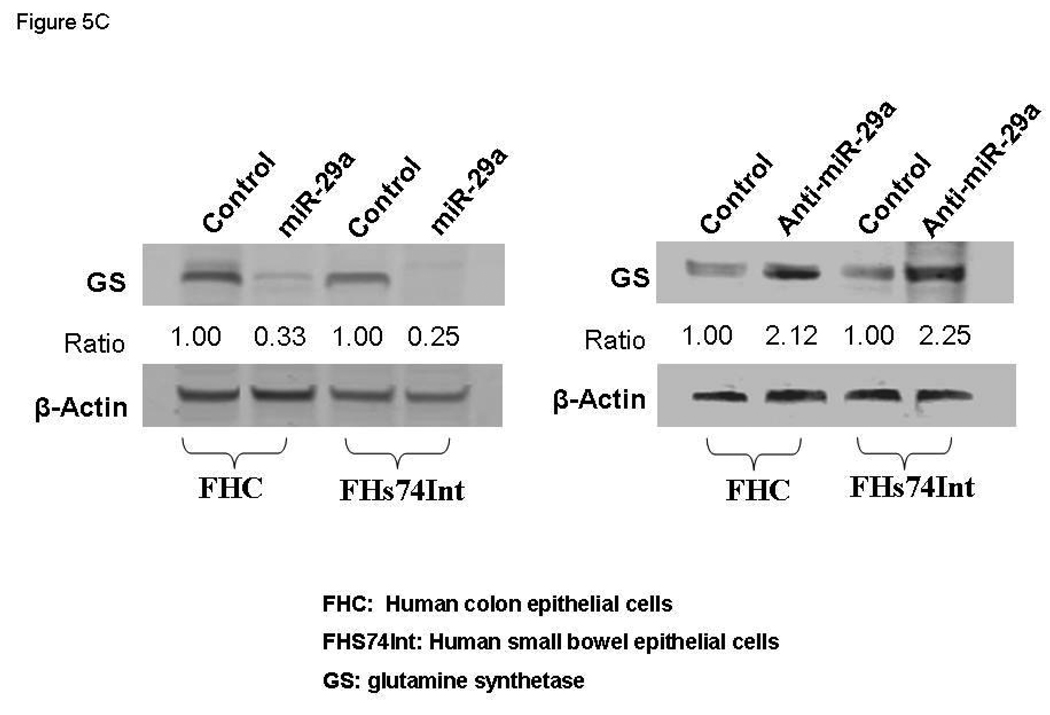
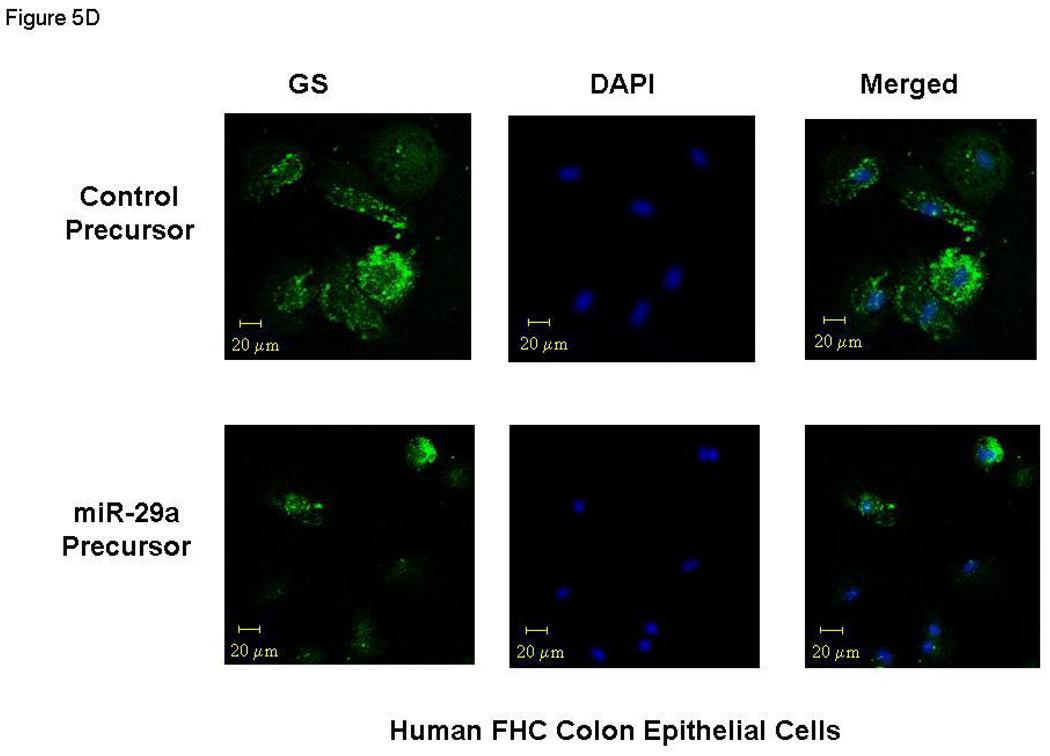
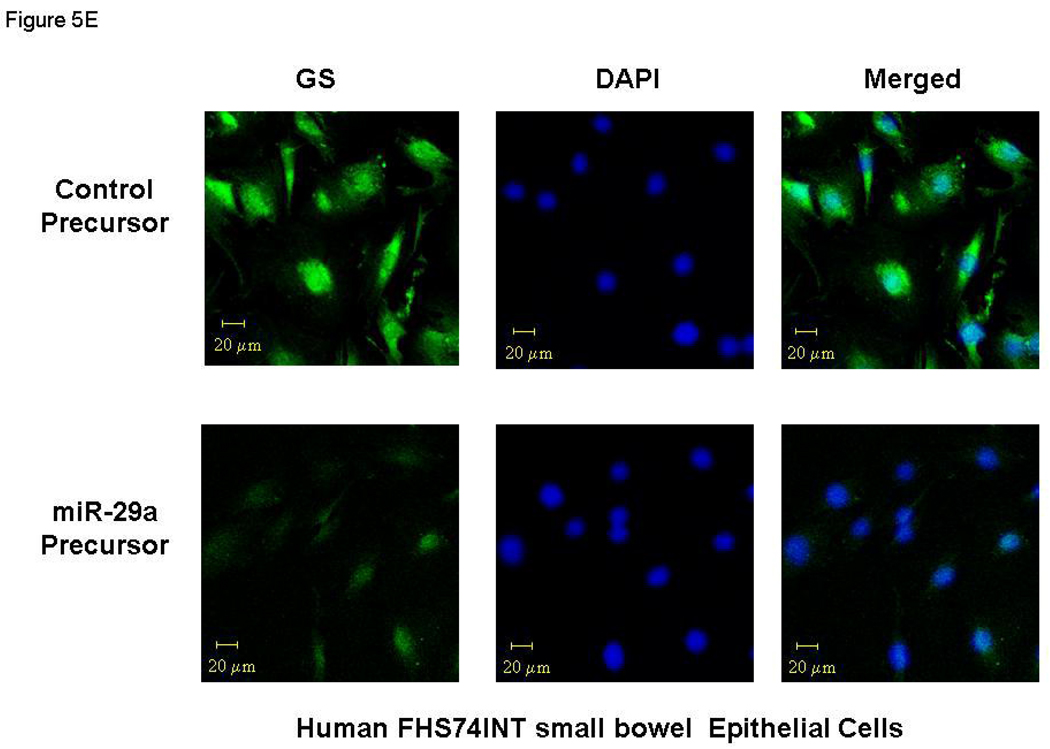
Background: The molecular mechanisms underlying the pathophysiology of irritable bowel syndrome (IBS) are poorly understood. One mechanism may involve increased intestinal permeability that is reversed with glutamine supplementation. Our goal was to evaluate the expression of glutamine synthetase and its complementary miRNA in blood microvesicles and gut tissues of IBS patients with increased intestinal membrane permeability.

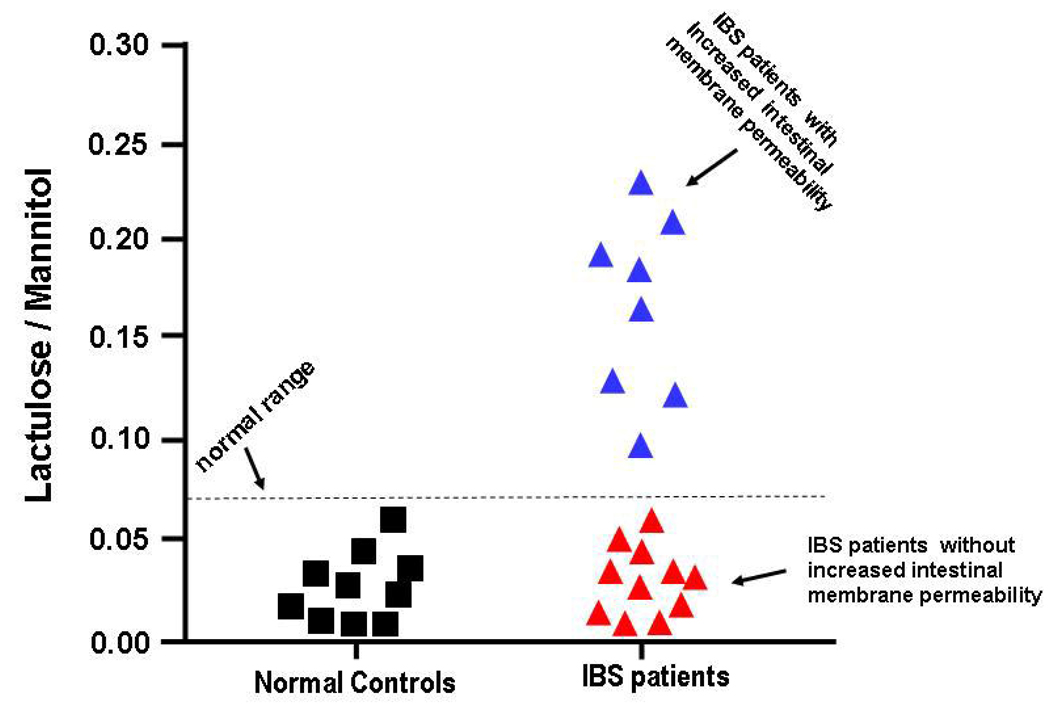
Methods: We evaluated 19 diarrhoea-predominant IBS patients and 10 controls for intestinal membrane permeability using the lactulose/mannitol method. miRNA expression was evaluated in blood microvesicles and gut tissue. To further confirm the relationship between miRNA and glutamine synthetase expression, cell culture experiments were conducted. Glutamine synthetase was also evaluated in the gut tissues of patients.

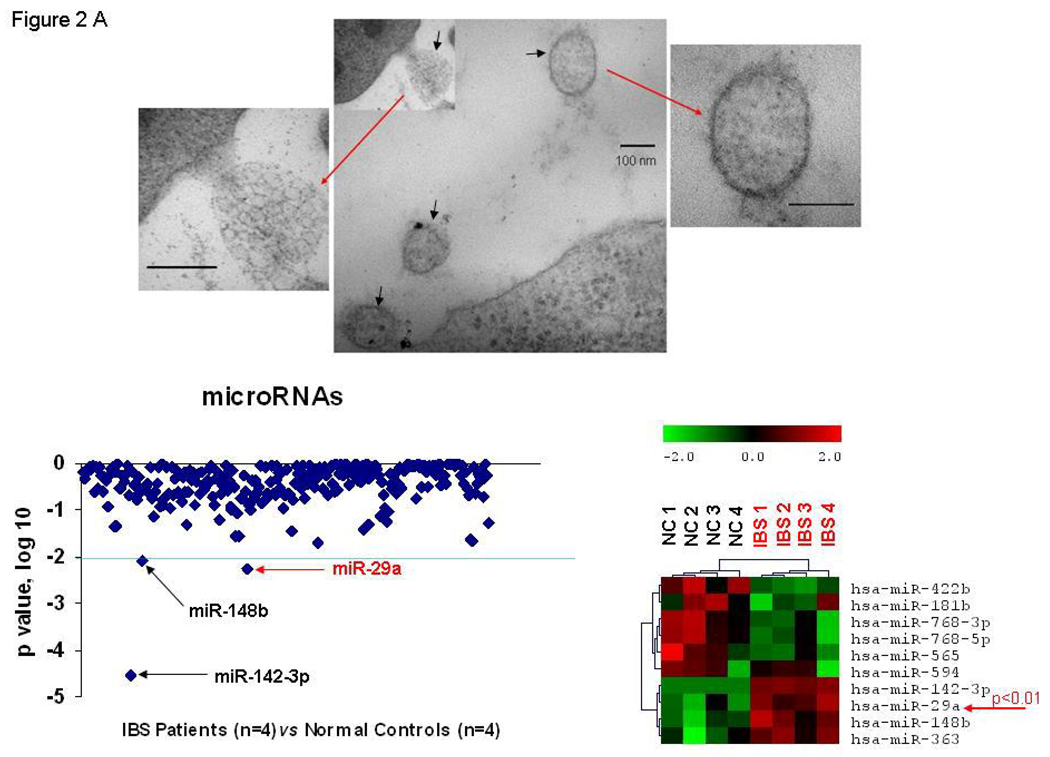
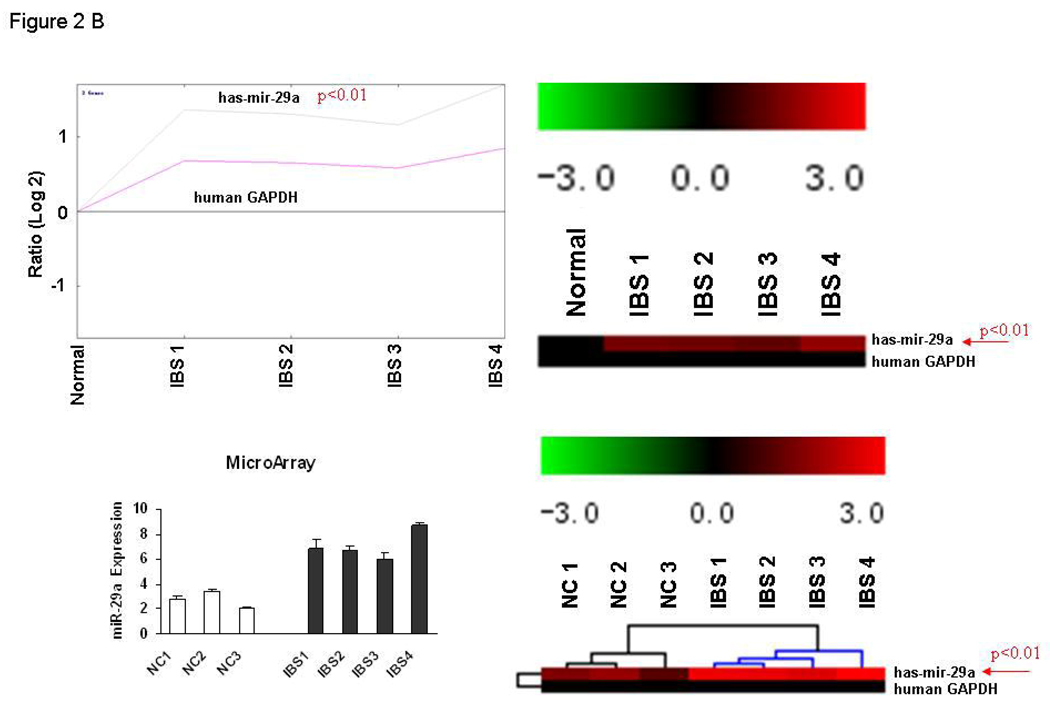
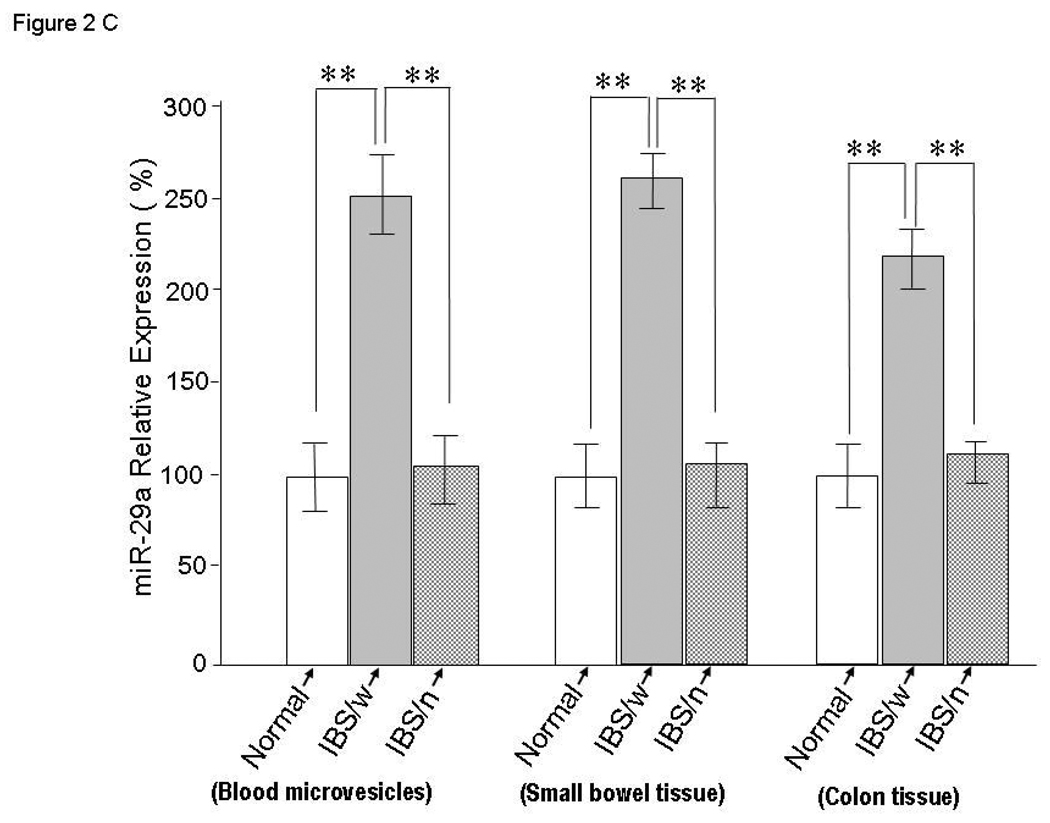
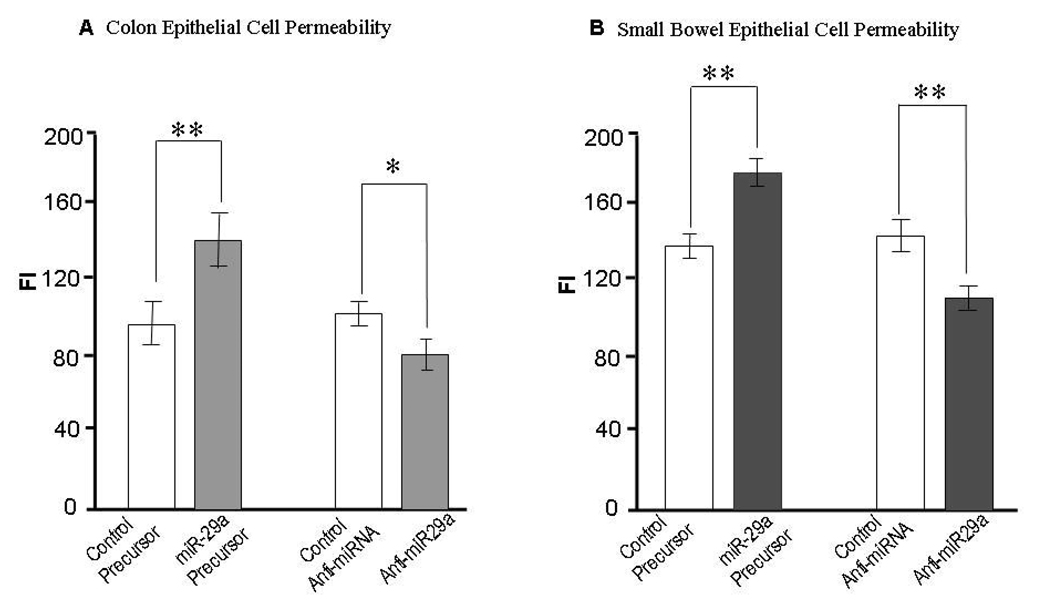
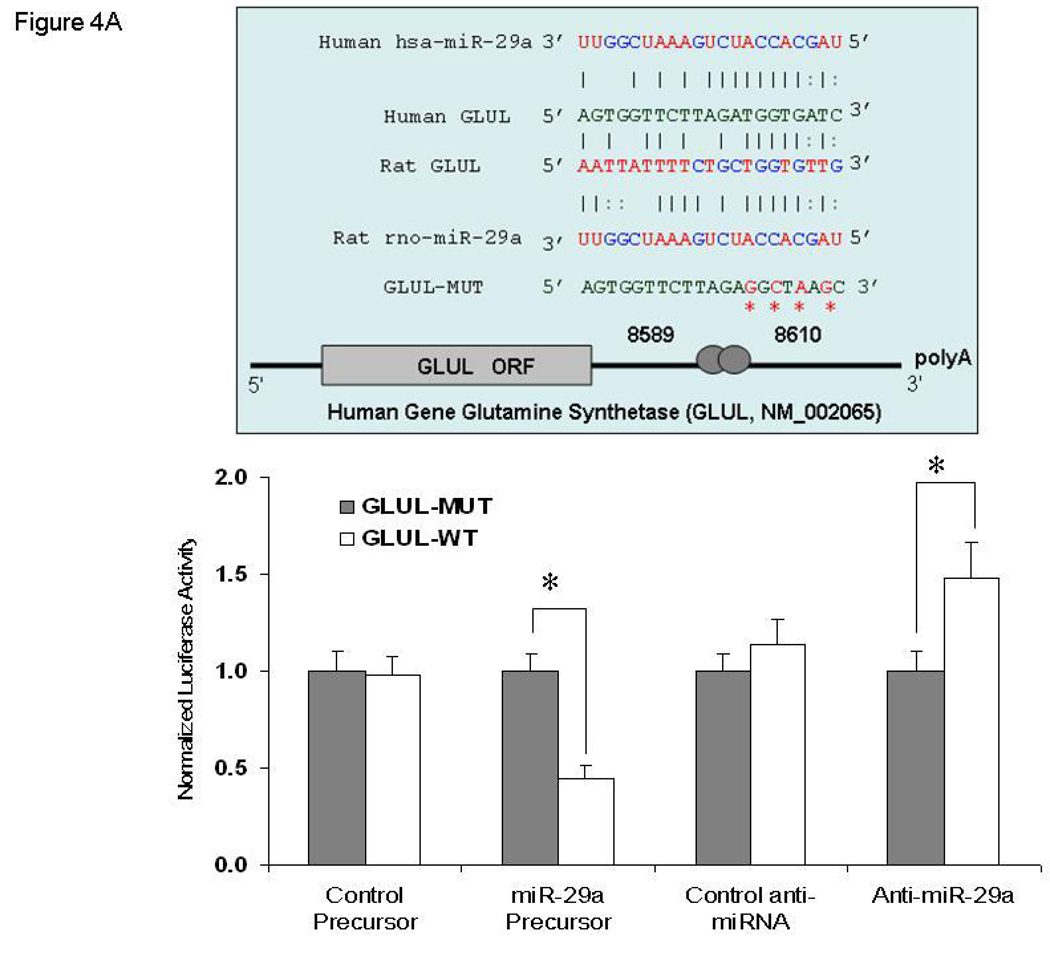
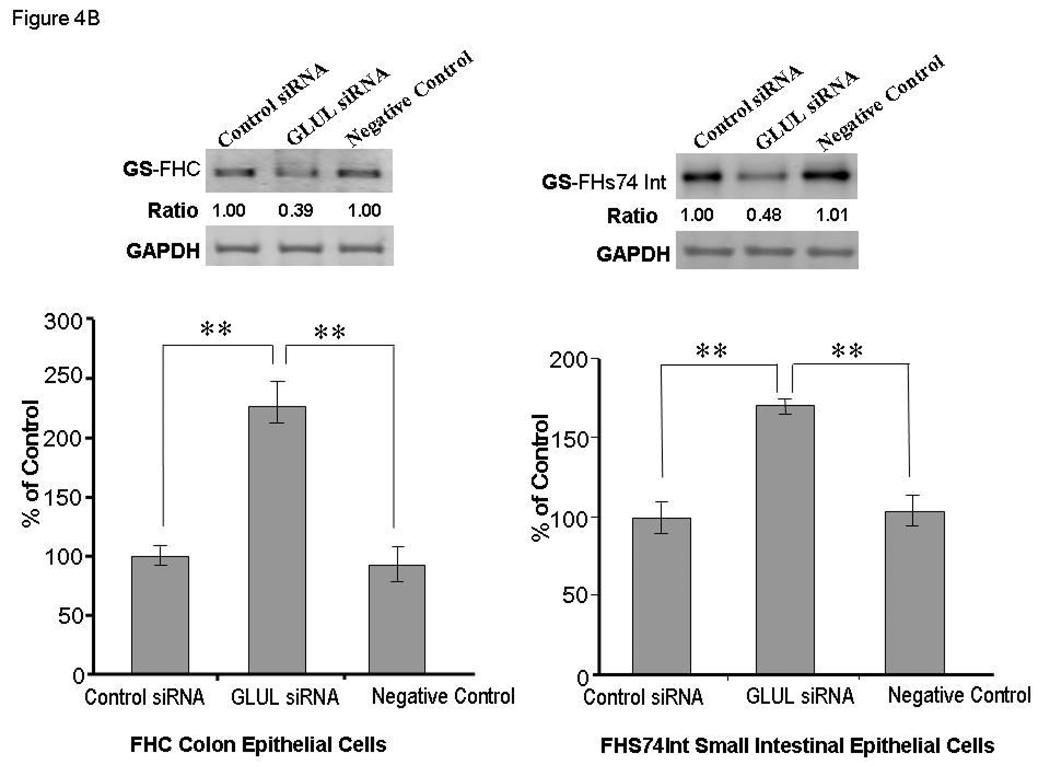
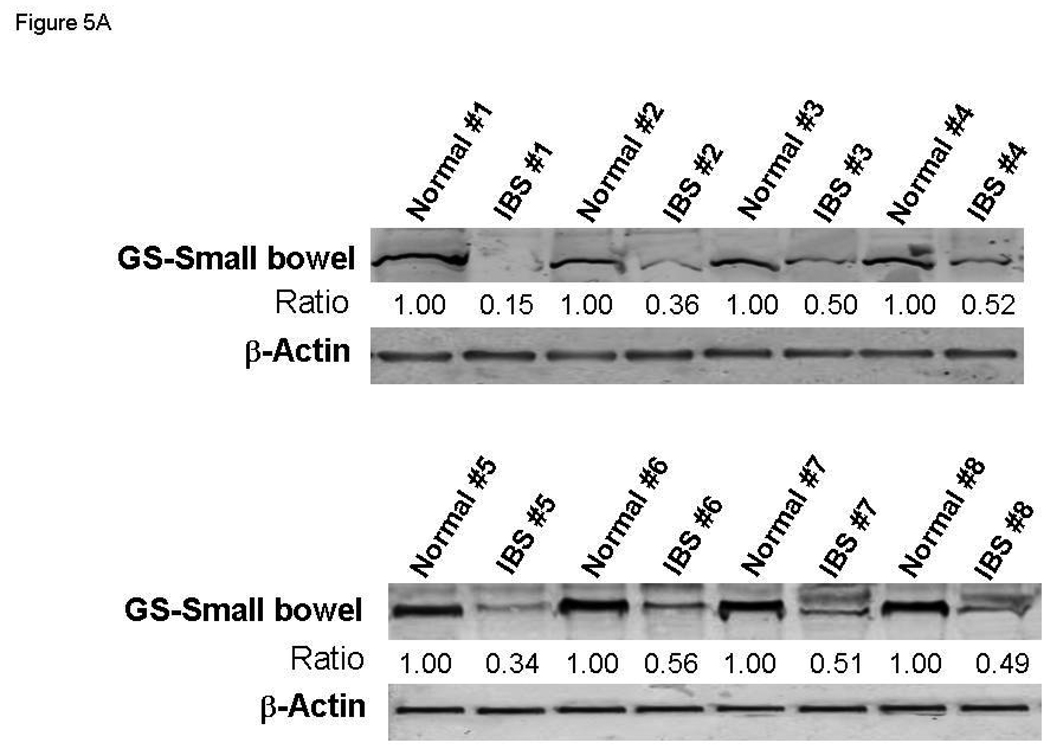
Results: A subset of patients with IBS (8/19, 42%) had increased intestinal membrane permeability and decreased glutamine synthetase expression compared to patients with IBS normal membrane permeability, and to controls. Expression of miR-29a was increased in blood microvesicles, small bowel and colon tissues of IBS patients with increased intestinal membrane permeability. Increased intestinal permeability was modulated by miR-29a which has a complementary site in the 3'-UTR of the GLUL gene.

Conclusions: The results support the conclusion that GLUL regulates intestinal membrane permeability and miR-29a regulates both GLUL and intestinal membrane permeability. The data suggests that miR-29a effects on intestinal membrane permeability may be due to its regulation of GLUL. Targeting this signalling pathway could lead to a new therapeutic approach to the treatment of patients with IBS, especially because small molecules that mimic or inhibit miRNA-based mechanisms are readily available.


Figures

Figure 1
Figure 1
This figure depicts 0–5 hour collection for lactulose/mannitol excretion ratios. A lactulose/mannitol excretion ratio ≥0.07 indicated increased intestinal permeability.
Figure 2
Figure 2
Alterations in miRNA expression in blood microvesicles and colon tissues from IBS Patients. Panel A: Upper panel – Illustrates electron microscope picture of blood-microvesicle; Left lower panel – We randomly selected blood-microvesicles from 4 of the 8 IBS patients with increased membrane permeability and 4 normal controls. Total RNA and miRNA were isolated from blood microvesicles and miRNA profiling was done. The log (base 10) ratio of P values for relative miRNA expression was plotted for each miRNA in descending order of formal name. Representative p-values for spots as calculated by unpaired tests for selected miRNAs from whole blood microvesicles of IBS patients vs. controls. The lower right graph shows the generated heat maps that were row normalized between samples based on the minimum and maximum values for each miRNA and thus provided a non-quantitative visual representation of relative differences between each miRNA. The heat map of the most up-regulated and down-regulated miRNAs is illustrated in the lower right graph. miR-29a was increased in blood microvesicle samples from all four IBS patients when compared to controls (p < 0.01). Panel B: Differential expression of miR-29a in colon tissues from IBS patients. Top two panels represent fold-change in miR-29a expression in IBS patients compared with controls. Bottom two panels illustrate the miR-29a/GAPDH expression ratios in 4 IBS patients and 3 controls. Panel C: miRNA expression analysis for miR-29a was done using TaqMan microRNA qRT-PCR Assay kits. Quantitative data from 8 IBS patients with increased intestinal membrane permeability, 8 IBS patient without increased intestinal membrane permeability, and 8 normal controls representing the mean and standard error are presented in the bar graph. (**p<0.001 compared with expression in controls, there is no differences between normal control and IBS with normal permeability). IBS/w = IBS with increased intestinal permeability; IBS/n = IBS without increased intestinal permeability.
Figure 2
Figure 2
Alterations in miRNA expression in blood microvesicles and colon tissues from IBS Patients. Panel A: Upper panel – Illustrates electron microscope picture of blood-microvesicle; Left lower panel – We randomly selected blood-microvesicles from 4 of the 8 IBS patients with increased membrane permeability and 4 normal controls. Total RNA and miRNA were isolated from blood microvesicles and miRNA profiling was done. The log (base 10) ratio of P values for relative miRNA expression was plotted for each miRNA in descending order of formal name. Representative p-values for spots as calculated by unpaired tests for selected miRNAs from whole blood microvesicles of IBS patients vs. controls. The lower right graph shows the generated heat maps that were row normalized between samples based on the minimum and maximum values for each miRNA and thus provided a non-quantitative visual representation of relative differences between each miRNA. The heat map of the most up-regulated and down-regulated miRNAs is illustrated in the lower right graph. miR-29a was increased in blood microvesicle samples from all four IBS patients when compared to controls (p < 0.01). Panel B: Differential expression of miR-29a in colon tissues from IBS patients. Top two panels represent fold-change in miR-29a expression in IBS patients compared with controls. Bottom two panels illustrate the miR-29a/GAPDH expression ratios in 4 IBS patients and 3 controls. Panel C: miRNA expression analysis for miR-29a was done using TaqMan microRNA qRT-PCR Assay kits. Quantitative data from 8 IBS patients with increased intestinal membrane permeability, 8 IBS patient without increased intestinal membrane permeability, and 8 normal controls representing the mean and standard error are presented in the bar graph. (**p<0.001 compared with expression in controls, there is no differences between normal control and IBS with normal permeability). IBS/w = IBS with increased intestinal permeability; IBS/n = IBS without increased intestinal permeability.
Figure 3
Figure 3
Modulation of colon and small bowel epithelial cell permeability by miR-29a. FHC colonic cells and FHs74Int small intestinal epithelial cells were transfected with either100 nmol/L miR-29a–specific miRNA precursors / inhibitors or control miRNA precursors / inhibitors. Permeability was assessed after 48 hours using In Vitro Permeability Assay Kits. Over-expression of miR-29a significantly enhanced epithelial permeability in FHC (Panel A) and FHs74Int (Panel B) cells whereas silencing miR-29a had the opposite effect (*p < 0.05, ** p< 0.01 when compared with controls).
Figure 4
Figure 4
Panel A: Identification of GLUL as a target of miR-29a. Top Graph: The location of the putative miR-29a target site in the GLUL 3'-UTR is shown. The sequence of the mutated target site with mutations to disrupt base pairing between miR-29a binding sites and GLUL is also displayed. The mutation sites are labeled with red symbol “*”. Bottom Graph: FHC human colon epithelial cells were transfected with 1 µg of the GLUL-wt or GLUL-mut firefly luciferase expression construct, along with either miR-29a or control precursors (or inhibitors). Luciferase assays were done after 48 h using a dual luciferase reporter assay system. All the groups are normalized to the average of GLUL MUT group co-transfected either with control precursor or with control anti-miRNA (average value = 1). A significant decrease (or increase) in relative firefly luciferase activity in the presence of wild type miR-29a with miR-29a precursors (or anti-miR-29a inhibitors) indicates the presence of a miR-29a modulated target sequence in the 3'-UTR of GLUL. Bars show mean ± SD from eight separate experiments done in triplicate (*p<0.05). Panel B: Lower panel indicate down-regulation of GLUL increased epithelial cell permeability. All the groups are normalized to the percentage of control siRNA group in both cell lines tested (average value of control siRNA group = 100%). The mean and standard deviation from 4 separate experiments are shown when compared with control siRNA-transfected cells (**p<0.001). Upper panel show immunoblot analysis: Cell lysates were obtained after in-vitro epithelial permeability for immunoblot analysis of glutamine synthetase expression. Down-regulation of GLUL silenced glutamine synthetase expression in FHC and FHs74Int cells. (GS= glutamine synthetase).
Figure 4
Figure 4
Panel A: Identification of GLUL as a target of miR-29a. Top Graph: The location of the putative miR-29a target site in the GLUL 3'-UTR is shown. The sequence of the mutated target site with mutations to disrupt base pairing between miR-29a binding sites and GLUL is also displayed. The mutation sites are labeled with red symbol “*”. Bottom Graph: FHC human colon epithelial cells were transfected with 1 µg of the GLUL-wt or GLUL-mut firefly luciferase expression construct, along with either miR-29a or control precursors (or inhibitors). Luciferase assays were done after 48 h using a dual luciferase reporter assay system. All the groups are normalized to the average of GLUL MUT group co-transfected either with control precursor or with control anti-miRNA (average value = 1). A significant decrease (or increase) in relative firefly luciferase activity in the presence of wild type miR-29a with miR-29a precursors (or anti-miR-29a inhibitors) indicates the presence of a miR-29a modulated target sequence in the 3'-UTR of GLUL. Bars show mean ± SD from eight separate experiments done in triplicate (*p<0.05). Panel B: Lower panel indicate down-regulation of GLUL increased epithelial cell permeability. All the groups are normalized to the percentage of control siRNA group in both cell lines tested (average value of control siRNA group = 100%). The mean and standard deviation from 4 separate experiments are shown when compared with control siRNA-transfected cells (**p<0.001). Upper panel show immunoblot analysis: Cell lysates were obtained after in-vitro epithelial permeability for immunoblot analysis of glutamine synthetase expression. Down-regulation of GLUL silenced glutamine synthetase expression in FHC and FHs74Int cells. (GS= glutamine synthetase).
Figure 5
Figure 5
miR-29a modulates expression of glutamine synthetase (GS). Small bowel tissue (Panel A) and colon tissue (Panel B) homogenates were obtained from 8 IBS patients with increased intestinal membrane permeability as well as 8 normal controls. Glutamine synthetase expression was significantly reduced in all 8 IBS patients compared with normal controls. Panel C: FHC human colon and FHs74Int small bowel epithelial cells were transfected with 100 nmol/L miR-29a control or precursors. Cell lysates were obtained after 72 hours for immunoblot analysis of glutamine synthetase expression. Up-regulation of miR-29a significantly silenced glutamine synthetase expression in human colon and intestinal epithelial cells. Panels D & E: Human FHC colon and human FHs74Int small bowel epithelial cells were transfected with 100 nmol/L miR-29a precursor or control construct. Immunocyto-chemistry for glutamine synthetase (GS) was done after 72 hours. A decrease in glutamine synthetase expression was observed in both types of epithelial cells transfected with miR-29a precursor (lower panels) compared with control precursor (upper panels).
Figure 5
Figure 5
miR-29a modulates expression of glutamine synthetase (GS). Small bowel tissue (Panel A) and colon tissue (Panel B) homogenates were obtained from 8 IBS patients with increased intestinal membrane permeability as well as 8 normal controls. Glutamine synthetase expression was significantly reduced in all 8 IBS patients compared with normal controls. Panel C: FHC human colon and FHs74Int small bowel epithelial cells were transfected with 100 nmol/L miR-29a control or precursors. Cell lysates were obtained after 72 hours for immunoblot analysis of glutamine synthetase expression. Up-regulation of miR-29a significantly silenced glutamine synthetase expression in human colon and intestinal epithelial cells. Panels D & E: Human FHC colon and human FHs74Int small bowel epithelial cells were transfected with 100 nmol/L miR-29a precursor or control construct. Immunocyto-chemistry for glutamine synthetase (GS) was done after 72 hours. A decrease in glutamine synthetase expression was observed in both types of epithelial cells transfected with miR-29a precursor (lower panels) compared with control precursor (upper panels).

Comment in

Similar articles

Cited by

References

    1. Verne GN, Cerda JJ. Irritable bowel syndrome. Streamlining the diagnosis. Postgrad Med. 1997;102:197–208. - PubMed
    1. Verne GN, Himes NC, Robinson ME, et al. Central representation of visceral and cutaneous hypersensitivity in the irritable bowel syndrome. Pain. 2003;103(1–2):99–110. - PubMed
    1. Verne GN, Robinson ME, Price DD. Hypersensitivity to visceral and cutaneous pain in the irritable bowel syndrome. Pain. 2001;93(1):7–14. - PubMed
    1. Dunlop SP, Hebden J, Campbell E, et al. Abnormal intestinal permeability in subgroups of diarrhea-predominant irritable bowel syndromes. Am J Gastroenterol. 2006;101:1288–1294. - PubMed
    1. Spiller RC, Jenkins D, Thornley JP, et al. Increased rectal mucosal enteroendocrine cells, T lymphocytes, and increased gut permeability following acute Campylobacter enteritis and in post-dysenteric irritable bowel syndrome. Gut. 2000;47:804–811. - PMC - PubMed

Publication types

MeSH terms