. 2009 Nov 30;187(5):733-47.
doi: 10.1083/jcb.200904054.

Clathrin mediates integrin endocytosis for focal adhesion disassembly in migrating cells

Affiliations

Clathrin mediates integrin endocytosis for focal adhesion disassembly in migrating cells

Ellen J Ezratty et al. J Cell Biol. .

Abstract

Focal adhesion disassembly is regulated by microtubules (MTs) through an unknown mechanism that involves dynamin. To test whether endocytosis may be involved, we interfered with the function of clathrin or its adaptors autosomal recessive hypercholesteremia (ARH) and Dab2 (Disabled-2) and found that both treatments prevented MT-induced focal adhesion disassembly. Surface labeling experiments showed that integrin was endocytosed in an extracellular matrix-, clathrin-, and ARH- and Dab2-dependent manner before entering Rab5 endosomes. Clathrin colocalized with a subset of focal adhesions in an ARH- and Dab2-dependent fashion. Direct imaging showed that clathrin rapidly accumulated on focal adhesions during MT-stimulated disassembly and departed from focal adhesions with integrin upon their disassembly. In migrating cells, depletion of clathrin or Dab2 and ARH inhibited focal adhesion disassembly and decreased the rate of migration. These results show that focal adhesion disassembly occurs through a targeted mechanism involving MTs, clathrin, and specific clathrin adaptors and that direct endocytosis of integrins from focal adhesions mediates their disassembly in migrating cells.


Figures
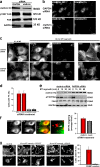
Figure 1.
Figure 1.
Clathrin is required for MT-induced focal adhesion disassembly. (a) Western blot of clathrin heavy chain (HC) siRNA– or GAPDH siRNA–treated NIH3T3 fibroblasts showing levels of clathrin heavy chain, FAK, pY397 FAK, and GAPDH. (b) Clathrin heavy chain immunofluorescence and transferrin uptake in GAPDH- and clathrin heavy chain–depleted NIH3T3 fibroblasts. (c) Immunofluorescence of vinculin, actin, and transferrin uptake during MT-induced focal adhesion disassembly in GAPDH- and clathrin heavy chain–depleted NIH3T3 fibroblasts. Images are before MT regrowth (10 µM nocodazole [NZ] for 4 h) and 40 min after nocodazole washed out and MT regrowth. (d) Quantification of focal adhesion (FA) disassembly in clathrin heavy chain (clthc)–, GAPDH-, or mock-depleted NIH3T3 fibroblasts. Cells were scored positive if they retained 10 focal adhesions after MT-induced disassembly. Data are from five independent experiments in which several hundred cells were analyzed for each condition in each experiment. (e) Western blot of clathrin heavy chain, pY397 FAK, total FAK, and GAPDH during MT regrowth after nocodazole washout in cells depleted of either clathrin or GAPDH. Cells were treated with nocodazole for 4 h, and then the drug was washed out, and MTs were allowed to regrow for the indicated times before preparing samples for SDS-PAGE. (f) Immunofluorescence of vinculin and MTs after nocodazole washout (40 min) in cells depleted of clathrin. The region outlined by the box in the merged panel is shown at higher magnification at the right. The arrowhead indicates a focal adhesion targeted by an MT. The histogram shows the number of MT–focal adhesion targeting events in clathrin- or mock-depleted cells. Data are from two experiments in which 20 cells were analyzed per condition. (g) Vinculin immunofluorescence and transferrin uptake in cells expressing FKBP–clathrin LC–GFP (arrows) and treated with or without AP20187. Images shown are before (10 µM nocodazole) and 40 min after MT regrowth. The cell expressing FKBP–clathrin LC is outlined in white to show that it does not endocytose transferrin. The histogram shows quantification of focal adhesion disassembly in FKBP-LC versus nontransfected cells. (d, f, and g) Error bars are SEM. Bars, 15 µm.
Figure 2.
Figure 2.
α5β1 integrin is internalized by a clathrin- and ECM-dependent mechanism during MT-induced focal adhesion disassembly. (a) Surface α5 integrin levels in NIH3T3 cells measured by flow cytometry before (no nocodazole [noco]) and during MT-induced focal adhesion disassembly. The histogram represents mean fluorescent intensity for each sample normalized to the value at 0 min MT regrowth. Data are from three independent experiments. (b) Comparison of surface α5 and α1 integrin levels in HA1 NIH3T3 cells measured by flow cytometry during MT-induced focal adhesion disassembly. The histogram represents the mean fluorescent intensity for each sample normalized to the value at 0 min MT regrowth. Data are from two independent experiments. (c) Levels of surface α5 integrin in NIH3T3 cells depleted of either clathrin or GAPDH and stimulated for MT-induced focal adhesion disassembly. The histogram represents the mean fluorescent intensity normalized to the value at 0 min MT regrowth. Data are the mean of three independent experiments. *, P < 0.01 by Student’s t test. (d) Immunofluorescence of β1 integrin in NIH3T3 fibroblasts transiently transfected with Rab5Q79L-GFP and treated with 10 µM nocodazole (NZ) or after 30 min of MT regrowth. Arrowheads in the top panel indicate Rab5Q79L-GFP endosomes that do not contain internalized integrin; arrowheads in the bottom panel indicate Rab5Q79L-GFP endosomes that contain internalized integrin. (e) Quantification of the extent of colocalization of β1 integrin with Rab5Q79L-GFP–positive endosomes at 0 and 60 min of MT regrowth. The histogram represents two independent experiments in which 10 cells were analyzed for each condition. (f) Immunofluorescence of β1 integrin accumulation in a transferrin- and Rab11-positive compartment during MT-induced focal adhesion disassembly. The left panel shows β1 integrin in nocodazole-treated cells. Panels on the right show β1 integrin colocalization with internalized transferrin or Rab11 in a perinuclear compartment 60 min after MT regrowth. Arrows indicate β1 integrin colocalizing with transferrin (top) or Rab11 (bottom). (a–c and e) Error bars are SEM. Bars, 15 µm.
Figure 3.
Figure 3.
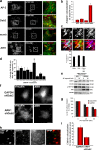
Clathrin localization and dynamics during MT-induced focal adhesion disassembly. (a) TIRF image of a nocodazole-treated NIH3T3 fibroblast immunostained with antibodies against pY397 FAK and clathrin heavy chain. The merged image shows pY397 FAK (red) and clathrin (green). The region outlined by the box is shown at higher magnification on the right. The histogram shows the number of focal adhesions with clathrin puncta. (b) The left panel shows a merged TIRF image of an NIH3T3 cell line stably expressing GFP-clathrin (green) and transiently transfected with RFP-FAK (red) 18 min after MT regrowth to stimulate focal adhesion disassembly. The outlined region is shown at higher magnification in the panels on the right during time points after MT regrowth (minutes:seconds). Note that clathrin puncta colocalize with and accumulate on the disassembling focal adhesion. (c) Quantification of clathrin and FAK fluorescence during disassembly of the focal adhesion shown in b. (d) TIRF images from a video of GFP-clathrin accumulation at focal adhesions initially devoid of clathrin during MT regrowth in RFP-FAK–expressing cells as in b. Time is in minutes:seconds after MT regrowth. (e) Quantification of clathrin and FAK fluorescence during disassembly of the large focal adhesion in the top row of d. (f) Histogram indicating the fold clathrin accumulation during disassembly of focal adhesions (FA) initially containing low or high levels of clathrin before MT regrowth. Data are from 25–30 focal adhesions. Error bars are SEM. (g) TIRF images from a video of GFP-clathrin and focal adhesions (RFP-FAK) in a cell treated with nocodazole for 4 h and imaged while still in nocodazole. Time is in minutes:seconds. (h) Quantification of clathrin and FAK fluorescence of the large focal adhesion in the top row of g. noco, nocodazole. Bars: (a, b [insets], d, and g) 2 µm; (b) 15 µm.
Figure 4.
Figure 4.
Direct imaging of clathrin and β1 integrin during focal adhesion disassembly. (a) TIRF imaging of GFP–β1 integrin during MT-induced focal adhesion disassembly. Time is in minutes:seconds after nocodazole washout. The boxed region is shown magnified at various time points in the panels on the right. (b and c) Montages from TIRF imaging of DsRed-clathrin and GFP–β1 integrin during focal adhesion disassembly. Time is in minutes:seconds. The boxed areas are depicted in the panels on the right. In the merged panels, arrowheads point to clathrin/β1 integrin puncta that colocalize and then simultaneously disappear. (d) Quantification of the behavior of β1 integrin–associated clathrin puncta. The histogram represents data from 30 focal adhesions in four different videos, in which 50 individual clathrin puncta were analyzed during focal adhesion (FA) disassembly. Error bars are SEM. Bars: (a) 10 µm; (b and c) 2 µm.
Figure 5.
Figure 5.
Clathrin adaptors Dab2 and ARH localize to focal adhesions and are required for MT-induced focal adhesion disassembly and recruitment of clathrin to focal adhesions. (a) TIRF images of NIH3T3 fibroblasts treated with 10 µM nocodazole for 4 h and immunostained with antibodies against either pY397 FAK or vinculin and the indicated clathrin adaptors. Boxed regions are shown at higher magnification in the merged images in the panels on the right. (b) Quantification of adaptor protein colocalization with focal adhesion (FA) area in nocodazole-treated cells. The histogram represents data from two independent experiments in which colocalization was measured in 10–20 individual cells. (c) TIRF images of NIH3T3 fibroblasts treated with 10 µM nocodazole for 4 h and immunostained with antibodies against pY397 FAK, Dab2, and clathrin. The bottom row shows merged images as indicated. Arrowheads point to individual puncta of Dab2 and clathrin that colocalize at the focal adhesion. Data in the histogram show the percentage of focal adhesions with clathrin, Dab2, or clathrin and Dab2 colocalization. (d) Quantification of focal adhesion disassembly in NIH3T3 fibroblasts treated with the indicated siRNAs or short hairpin RNAs. The histogram represents data from three independent experiments in which several hundred cells were analyzed per condition. For ARH/Dab2: *, P = 0.004 by two-tailed Student’s t test compared with GAPDH. For individual ARH, Dab2, or numb: P > 0.2 (two-tailed Student’s t test compared with GAPDH). (e) Western blot of pY397 FAK during MT regrowth after nocodazole washout in an shDab2 cell line depleted of either ARH or GAPDH with siRNAs. Cells were treated for 4 h with nocodazole, and then the drug was washed out, and MTs were allowed to regrow for the indicated time. Vinculin is shown as a loading control. (f) Immunofluorescence of vinculin and ARH in an shDab2 cell line depleted of GAPDH or ARH by siRNA and stimulated for focal adhesion disassembly by MT regrowth for 60 min. (g) Levels of surface α5 integrin in NIH3T3 cells depleted of either Dab2 and ARH or GAPDH and stimulated for MT-induced focal adhesion disassembly. The histogram represents the mean fluorescent intensity normalized to the value at 0 min of MT regrowth. Data are averaged from five independent experiments. *, P = 0.003 by Student’s t test. (h) TIRF images of shDab2 cell line depleted of ARH and immunostained for pY397 FAK, clathrin heavy chain, or CD44 to visualize the plasma membrane. (i) Quantification of clathrin colocalization with focal adhesion area in shDab2 cells depleted of either GAPDH or ARH by siRNA. The histogram represents two experiments in which 15 cells were analyzed for each condition. (b–d, g, and i) Error bars are SEM. Bars: (a, f, and h) 15 µm; (c) 1 µm.
Figure 6.
Figure 6.
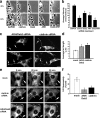
Clathrin and adaptor protein localization during polarized cell migration. (a) TIRF image of an NIH3T3 fibroblast migrating into an in vitro wound immunostained with antibodies against pY397 FAK and clathrin. The white line shows the wound edge. The merge image shows pY397 FAK (red) and clathrin (green). The boxed region in the merge image is shown at higher magnification on the right. The arrow indicates a focal adhesion located behind the leading edge that has accumulated clathrin puncta. (b) Representative images used for quantitative colocalization of clathrin and focal adhesions in different regions of an NIH3T3 fibroblast migrating into an in vitro wound and immunostained with antibodies against MTs, pY397 FAK, and clathrin. The MT image shows the cell outline and four regions used for quantification (see Materials and methods). The merged image shows pY397 FAK (red) and clathrin heavy chain (green) and the four regions. Arrowheads indicate focal adhesions that colocalize with clathrin puncta. (c) Quantification of focal adhesion (FA) area that colocalizes with clathrin puncta in the four regions defined in b. The histogram represents data from two independent experiments in which 15–20 individual cells were analyzed. (d) Images of NIH3T3 fibroblasts migrating into an in vitro wound and immunostained for MTs, vinculin or pY397 FAK, and ARH or Dab2. The merged images at right show pY397 FAK or vinculin (red) and ARH or Dab2 (green). An individual migrating cell at the wound edge is indicated by the outline. Arrowheads indicate focal adhesions that colocalized with either ARH or Dab2 puncta. (e) Quantification of adaptor protein colocalization with focal adhesion area in the four regions defined in b. The histogram represents data from two independent experiments in which colocalization was measured in 10–20 individual cells. (c and e) Error bars are SEM. Bars, 15 µm.
Figure 7.
Figure 7.
Clathrin and clathrin adaptors are required for focal adhesion disassembly and polarized cell migration. (a) Phase images from videos of NIH3T3 cells treated with the indicated siRNA and allowed to migrate into a wound. The same wound edge is shown at 0 and 6 h of migration. (b) Quantification of wound migration velocity of cells depleted of clathrin or clathrin adaptors. The histogram represents two to three independent experiments in which 20 wounds were analyzed per condition. *, P ≤ 0.0001 for each condition compared with GAPDH by Student’s t test. (c) Immunofluorescence of NIH3T3 cells depleted of either clathrin or Dab2 and ARH and immunostained for vinculin. Cells were allowed to migrate into a wound for 9 h before processing for immunofluorescence. Arrows indicate examples of elongated tails. (d) Quantification of tail length in migrating cells depleted of clathrin or clathrin adaptors. The histogram represents two independent experiments in which at least 20 cells were analyzed per condition. *, P ≤ 0.005 for each condition compared with mock by Student’s t test. (e) Fluorescence images from videos of migrating NIH3T3 cells stably expressing GFP-FAK and depleted of clathrin, Dab2, and ARH or mock treated (0-, 20-, or 30-min time points are shown). Small arrows point to focal adhesions that disassemble during 30 min of cell migration. Arrowheads point to focal adhesions that fail to disassemble during 30 min of cell migration. Large arrows indicate the direction of migration. (f) Quantitative analysis of focal adhesion (FA) disassembly in cells depleted of clathrin or ARH and Dab2. The histogram shows the percentage of focal adhesions that disassemble per cell during a 30-min interval. For each of the conditions analyzed, focal adhesion disassembly was quantified for at least 10 different cells (30–50 adhesions per cell) from five to eight separate videos. (b, d, and f) Error bars are SEM. Bars, 15 µm.

Similar articles

Cited by

References

    1. Abercrombie M. 1980. The crawling behavior of metazoan cells. Proc. R. Soc. Lond. B. Biol. Sci. 207:129–147 10.1098/rspb.1980.0017 - DOI
    1. Benmerah A., Poupon V., Cerf-Bensussan N., Dautry-Varsat A. 2000. Mapping of Eps15 domains involved in its targeting to clathrin-coated pits. J. Biol. Chem. 275:3288–3295 10.1074/jbc.275.5.3288 - DOI - PubMed
    1. Briesewitz R., Kern A., Marcantonio E.E. 1993. Ligand-dependent and -independent integrin focal contact localization: the role of the alpha chain cytoplasmic domain. Mol. Biol. Cell. 4:593–604 - PMC - PubMed
    1. Bruzzaniti A., Neff L., Sanjay A., Horne W.C., De Camilli P., Baron R. 2005. Dynamin forms a Src kinase-sensitive complex with Cbl and regulates podosomes and osteoclast activity. Mol. Biol. Cell. 16:3301–3313 10.1091/mbc.E04-12-1117 - DOI - PMC - PubMed
    1. Burridge K. 2005. Foot in mouth: do focal adhesions disassemble by endocytosis? Nat. Cell Biol. 7:545–547 10.1038/ncb0505-545 - DOI - PubMed

Publication types

MeSH terms