

The thioredoxin-thioredoxin reductase system can function in vivo as an alternative system to reduce oxidized glutathione in Saccharomyces cerevisiae
- PMID: 19951944
- PMCID: PMC2825406
- DOI: 10.1074/jbc.M109.062844
The thioredoxin-thioredoxin reductase system can function in vivo as an alternative system to reduce oxidized glutathione in Saccharomyces cerevisiae
Abstract
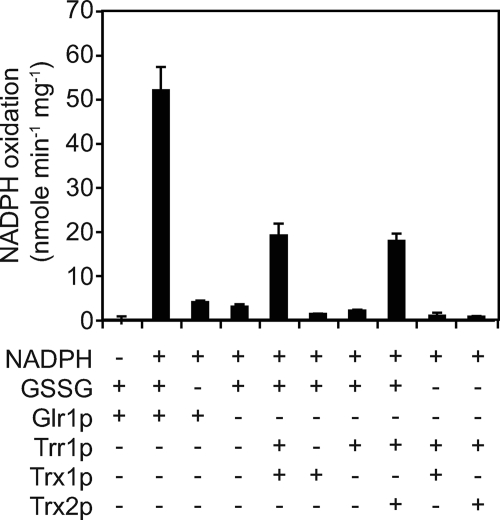
Cellular mechanisms that maintain redox homeostasis are crucial, providing buffering against oxidative stress. Glutathione, the most abundant low molecular weight thiol, is considered the major cellular redox buffer in most cells. To better understand how cells maintain glutathione redox homeostasis, cells of Saccharomyces cerevisiae were treated with extracellular oxidized glutathione (GSSG), and the effect on intracellular reduced glutathione (GSH) and GSSG were monitored over time. Intriguingly cells lacking GLR1 encoding the GSSG reductase in S. cerevisiae accumulated increased levels of GSH via a mechanism independent of the GSH biosynthetic pathway. Furthermore, residual NADPH-dependent GSSG reductase activity was found in lysate derived from glr1 cell. The cytosolic thioredoxin-thioredoxin reductase system and not the glutaredoxins (Grx1p, Grx2p, Grx6p, and Grx7p) contributes to the reduction of GSSG. Overexpression of the thioredoxins TRX1 or TRX2 in glr1 cells reduced GSSG accumulation, increased GSH levels, and reduced cellular glutathione E(h)'. Conversely, deletion of TRX1 or TRX2 in the glr1 strain led to increased accumulation of GSSG, reduced GSH levels, and increased cellular E(h)'. Furthermore, it was found that purified thioredoxins can reduce GSSG to GSH in the presence of thioredoxin reductase and NADPH in a reconstituted in vitro system. Collectively, these data indicate that the thioredoxin-thioredoxin reductase system can function as an alternative system to reduce GSSG in S. cerevisiae in vivo.
Figures


Similar articles
-
Overlapping roles of the cytoplasmic and mitochondrial redox regulatory systems in the yeast Saccharomyces cerevisiae.Eukaryot Cell. 2005 Feb;4(2):392-400. doi: 10.1128/EC.4.2.392-400.2005. Eukaryot Cell. 2005. PMID: 15701801 Free PMC article.
-
Non-reciprocal regulation of the redox state of the glutathione-glutaredoxin and thioredoxin systems.EMBO Rep. 2003 Feb;4(2):184-8. doi: 10.1038/sj.embor.embor729. EMBO Rep. 2003. PMID: 12612609 Free PMC article.
-
Thioredoxins are required for protection against a reductive stress in the yeast Saccharomyces cerevisiae.Mol Microbiol. 2002 Nov;46(3):869-78. doi: 10.1046/j.1365-2958.2002.03216.x. Mol Microbiol. 2002. PMID: 12410842
-
Involvement of thio-, peroxi-, and glutaredoxins in cellular redox-dependent processes.Biochemistry (Mosc). 2008 Dec;73(13):1493-510. doi: 10.1134/s0006297908130099. Biochemistry (Mosc). 2008. PMID: 19216714 Review.
-
The thioredoxin antioxidant system.Free Radic Biol Med. 2014 Jan;66:75-87. doi: 10.1016/j.freeradbiomed.2013.07.036. Epub 2013 Jul 27. Free Radic Biol Med. 2014. PMID: 23899494 Review.
Cited by
-
Susceptibility of human head and neck cancer cells to combined inhibition of glutathione and thioredoxin metabolism.PLoS One. 2012;7(10):e48175. doi: 10.1371/journal.pone.0048175. Epub 2012 Oct 31. PLoS One. 2012. PMID: 23118946 Free PMC article.
-
Inhibition of Thioredoxin/Thioredoxin Reductase Induces Synthetic Lethality in Lung Cancers with Compromised Glutathione Homeostasis.Cancer Res. 2019 Jan 1;79(1):125-132. doi: 10.1158/0008-5472.CAN-18-1938. Epub 2018 Nov 6. Cancer Res. 2019. PMID: 30401714 Free PMC article.
-
Thioredoxin-1: A Promising Target for the Treatment of Allergic Diseases.Front Immunol. 2022 Apr 28;13:883116. doi: 10.3389/fimmu.2022.883116. eCollection 2022. Front Immunol. 2022. PMID: 35572600 Free PMC article. Review.
-
Metabolic Reprogramming in Modulating T Cell Reactive Oxygen Species Generation and Antioxidant Capacity.Front Immunol. 2018 May 16;9:1075. doi: 10.3389/fimmu.2018.01075. eCollection 2018. Front Immunol. 2018. PMID: 29868027 Free PMC article. Review.
-
The response to heat shock and oxidative stress in Saccharomyces cerevisiae.Genetics. 2012 Apr;190(4):1157-95. doi: 10.1534/genetics.111.128033. Epub 2011 Dec 29. Genetics. 2012. PMID: 22209905 Free PMC article. Review.
References
-
- Schafer F. Q., Buettner G. R. (2001) Free Radic Biol. Med. 30, 1191–1212 - PubMed
-
- Perrone G. G., Tan S. X., Dawes I. W. (2008) Biochim. Biophys. Acta 1783, 1354–1368 - PubMed
-
- Rietsch A., Beckwith J. (1998) Annu. Rev. Genet. 32, 163–184 - PubMed
-
- Meister A., Anderson M. E. (1983) Annu. Rev. Biochem. 52, 711–760 - PubMed
-
- Hwang C., Sinskey A. J., Lodish H. F. (1992) Science 257, 1496–1502 - PubMed
Publication types
MeSH terms
Substances
LinkOut - more resources
Full Text Sources
Molecular Biology Databases
