. 2009 Dec;91(12):2903-14.
doi: 10.2106/JBJS.H.01464.

Femoral head deformation and repair following induction of ischemic necrosis: a histologic and magnetic resonance imaging study in the piglet

Affiliations

Femoral head deformation and repair following induction of ischemic necrosis: a histologic and magnetic resonance imaging study in the piglet

Frederic Shapiro et al. J Bone Joint Surg Am. 2009 Dec.

Abstract

Background: Ischemic necrosis of the femoral head can be induced surgically in the piglet. We used this model to assess femoral head deformation and repair in vivo by sequential magnetic resonance imaging and by correlating end-stage findings with histologic assessments.

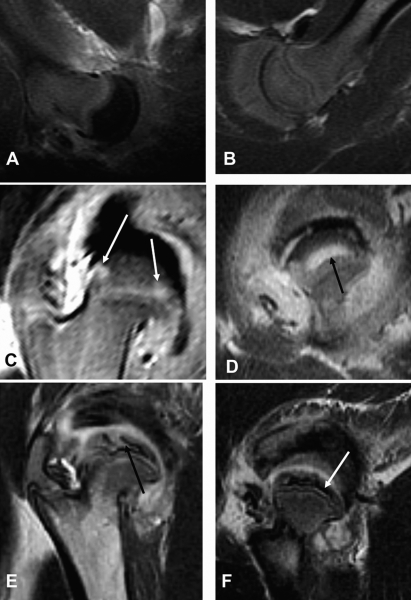
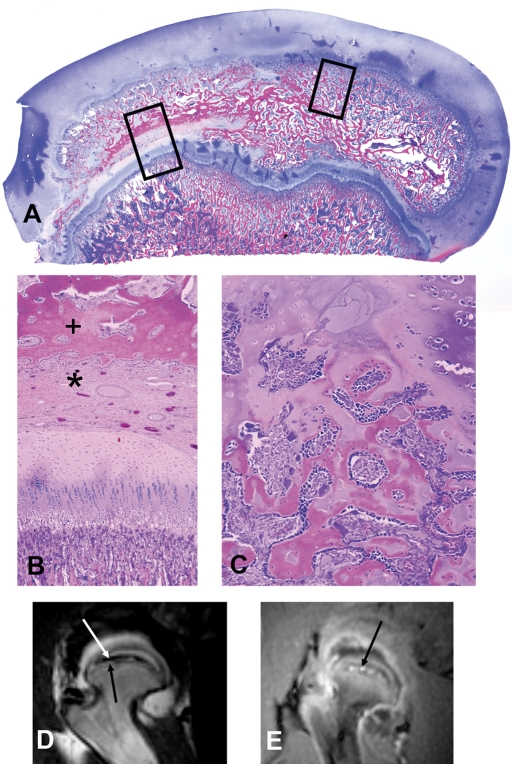
Methods: Ischemic necrosis of the femoral head was induced in ten three-week-old piglets by tying a silk ligature around the base of the femoral neck (intracapsular) and cutting the ligamentum teres. We used magnetic resonance imaging with the piglets under general anesthesia to study the hips at forty-eight hours and at one, two, four, and eight weeks. Measurements on magnetic resonance images in the midcoronal plane of the involved and control sides at each time documented the femoral head height, femoral head width, superior surface cartilage height, and femoral neck-shaft angle. Histologic assessments were done at the time of killing.

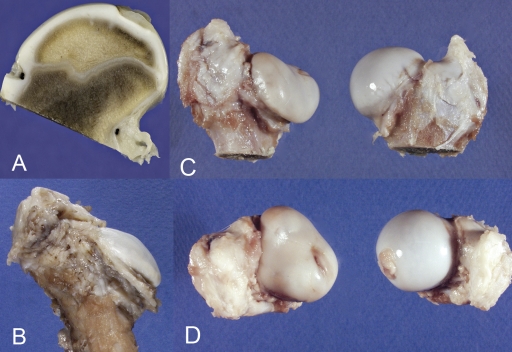
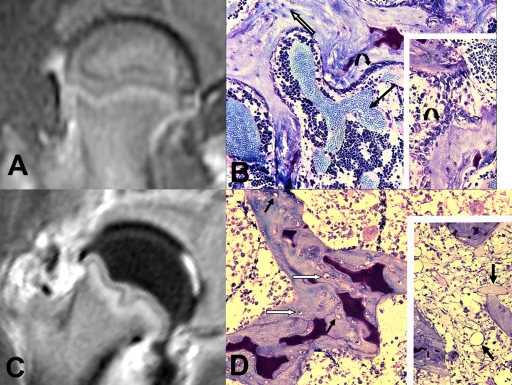
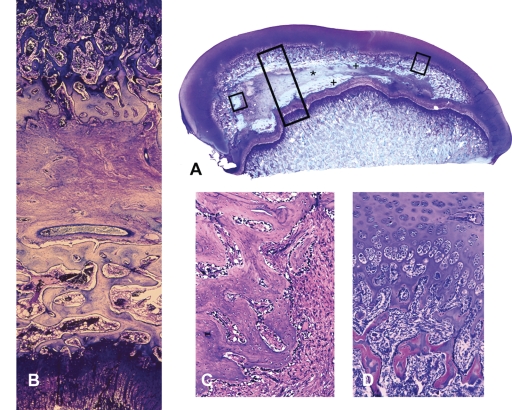
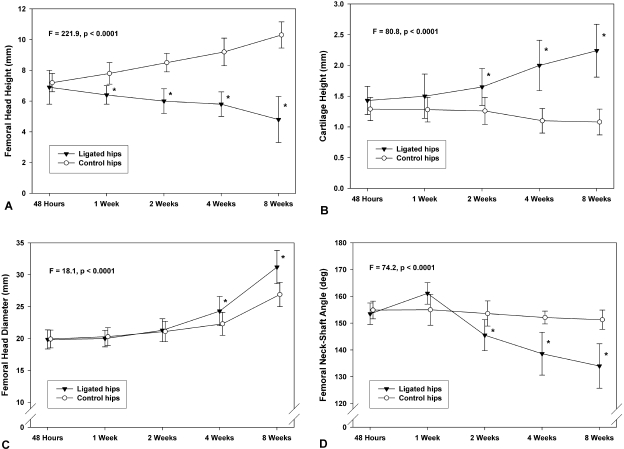
Results: Complete ischemia of the femoral head was identified in all involved femora by magnetic resonance imaging at forty-eight hours. Revascularization began at the periphery of the femoral head as early as one week and was underway in all by two weeks. At eight weeks, magnetic resonance imaging and histologic analysis showed deformation of the femoral head and variable tissue deposition. Tissue responses included (1) vascularized fibroblastic ingrowth with tissue resorption and cartilage, intramembranous bone, and mixed fibro-osseous or fibro-cartilaginous tissue synthesis and (2) resumption of endochondral bone growth. At eight weeks, the mean femoral head measurements (and standard error of the mean) for the control compared with the ligated femora were 10.4 +/- 0.4 and 4.8 +/- 0.4 mm, respectively, for height; 26.7 +/- 0.8 and 31.2 +/- 0.8 mm for diameter; 1.1 +/- 0.1 and 2.3 +/- 0.1 mm for cartilage thickness; and 151 degrees +/- 2 degrees and 135 degrees +/- 2 degrees for the femoral neck-shaft angle. Repeated-measures mixed-model analysis of variance revealed highly significant effects of ligation in each parameter (p < 0.0001).

Conclusions: Magnetic resonance imaging allows for the assessment of individual hips at sequential time periods to follow deformation and repair. There was a variable tissue response, and histologic assessment at the time of killing was shown to correlate with the evolving and varying magnetic resonance imaging signal intensities. Femoral head height on the ischemic side from one week onward was always less than the initial control value and continually decreased with time, indicating collapse as well as slowed growth. Increased femoral head width occurred relatively late (four to eight weeks), indicating cartilage model overgrowth concentrated at the periphery.


Figures

Fig. 1
Fig. 1
A: Midcoronal plane photograph of a decalcified femoral head and neck in a three-week and two-day-old piglet showing the location of the intracapsular circumferential suture. The piglet was killed forty-eight hours postoperatively after magnetic resonance imaging demonstrated complete femoral head ischemia. The intracapsular suture is the black dot on the medial and lateral surfaces of the neck and is placed at the lowest part of the neck adjacent to the capsular attachment. Note the large size of the secondary ossification center at this age. B: Photograph illustrating the gross appearance of the proximal end of a femur at eight weeks after surgery. The head and neck are shorter than normal, and the femoral head is markedly deformed. C: Photographs showing the operatively treated and nonoperatively treated proximal parts of femora from another piglet at eight weeks. The operatively treated femur (left) has a shorter neck, a relative increase of coxa vara, and a nonspherical head with flattening and obliquity of the superior surface. The medial third of the femoral head is least deformed and retains its sphericity best. The normal femoral head is at right. D: Looking down onto the superior surfaces of the same femoral heads, the misshapen head on the involved side is at the left, and the normal, noninvolved head is at the right. The involved head is asymmetric in shape along both the mediolateral and anteroposterior planes.
Fig. 2
Fig. 2
A: Magnetic resonance imaging of the normal, noninvolved femoral head at forty-eight hours showing normal signal intensity of the epiphysis and metaphysis on a T1-weighted sequence after gadolinium enhancement. B: Photomicrograph of a portion of the ossification center of the normal femoral head showing bone trabeculae with osteocytes in their lacunae (open arrow), surface osteoblasts (curved arrow) and osteoclasts, and well-vascularized marrow (solid straight arrow). The marrow also contains hematopoietic and mesenchymal cells. The red blood cells are within thin-walled sinusoidal vessels. In this tissue preparation, the red blood cells are circular and stained light blue. The dark purple accumulations are the remaining fragments of calcified cartilage from the endochondral sequence. The inset shows new bone trabeculae with osteocytes, surface osteoblasts (curved arrow), and mesenchymal cells differentiating to osteoblasts between the two trabeculae. An osteoclast is seen at the lower right adjacent to both a cartilage remnant and woven bone. This corresponds to the magnetic resonance imaging in A (paraffin-embedded section, 1% toluidine blue stain). C: Magnetic resonance imaging at forty-eight hours after surgery showing complete ischemia of the involved femoral head with a complete lack of epiphyseal gadolinium enhancement (T1-weighted sequence after gadolinium enhancement). The intra-articular region of high signal intensity is the cut ligamentum teres and surrounding synovial reaction. D: Photomicrograph illustrating a portion of the femoral head ossification center after induction of ischemia. The surfaces of the bone trabeculae are completely devoid of osteoblasts, and many of the lacunae are either empty (black arrows) or show contracted pyknotic osteocytes (white arrows). The marrow is acellular or hypocellular, and the sinusoidal vessels (inset; arrows) are empty of red blood cells. Revascularization has not yet occurred, so the bone trabeculae remain intact (paraffin-embedded section, 1% toluidine blue stain).
Fig. 3
Fig. 3
Magnetic resonance images from one piglet are shown at forty-eight hours (A, involved side and B, noninvolved side), one week (C), four weeks (D), and eight weeks (E and F). The femoral head underwent the common pattern of repair and deformation, which was seen in six of eight hips with long-term follow-up data. A: Magnetic resonance imaging of the involved femoral head at forty-eight hours showing absent signal intensity in the entire epiphysis with no enhancement with gadolinium, which is a sign of complete ischemia, while the normally perfused neck shows signal intensity indicative of persisting vascularization (T1-weighted sequence after gadolinium enhancement). B: Magnetic resonance imaging of the contralateral, noninvolved hip at forty-eight hours showing normal signal intensity indicating good vascularization of the femoral head and neck (T1-weighted sequence after gadolinium enhancement). C: Magnetic resonance imaging at one week after surgery showing high signal intensity at the point of entrance of the medial and lateral epiphyseal vessels into the femoral head (arrows) to initiate the repair response (T1-weighted sequence after gadolinium enhancement). D: Magnetic resonance imaging at four weeks after surgery showing the area of high signal intensity (arrow) in the central part of the femoral head, indicative of fibrovascular and/or vascularized cartilage repair tissue (T1-weighted sequence after gadolinium enhancement). E and F: Two T2-weighted magnetic resonance images in the coronal plane illustrating different depths of the same femoral head at eight weeks after surgery. The altered and deformed shape of the femoral head is evident. The tissue accumulations of differing signal intensities in both images are indicative of the spatially variable tissue repair. In E, the high signal intensity (arrow) entering the lateral portion of the head is the fibrovascular repair response. The low signal intensity surrounding the fibrovascular tissue represents dense repair bone, and the tissue above with intermediate signal intensity is cartilage undergoing endochondral ossification. In F, the femoral head has a greater proportion of tissue with low signal uptake, which represents accumulations of dense repair bone (arrow).
Fig. 4
Fig. 4
Histologic images corresponding to magnetic resonance images at eight weeks from the same femoral head illustrated in Figure 3, E and F, are shown. The figures are oriented in the same coronal plane as the magnetic resonance imaging scans. A: Photomicrograph of a coronal plane histologic section of the entire femoral head and physis (epiphysis) and the adjacent neck (metaphysis) are shown. The medial part of the head is at the right. The articular and epiphyseal cartilage thickness is increased from the normal (compare with Fig. E-1, B). The fibrovascular invasion (*) from a lateral point of entrance has passed in an arc-like fashion across the femoral head into the medial segment. Dense intramembranous bone formation (+) is seen at the upper and lower margins of the fibrovascular tissue. Endochondral bone formation resumes at the undersurface of the continuous articular-epiphyseal cartilage. This orientation corresponds to the magnetic resonance images in Figure 3, E and F, with the fibrovascular tissue of high signal intensity, the dense intramembranous bone of low signal intensity, and the endochondral tissue of intermediate signal intensity. Tissue within the long rectangular box is seen at higher magnification in B, from the smaller box at left in C, and from the box at the upper right in D (paraffin-embedded tissue, 1% toluidine blue stain). B: The prominent band of fibrovascular tissue is seen in the middle portion of the histologic section along with a large transversely oriented vessel. Below this accumulation, tissue differentiation by means of the intramembranous mechanism has formed woven bone on which lamellar bone is being synthesized. Endochondral bone has not formed at this site. Above the fibrovascular tissue, there is also new intramembranous bone synthesis and, above that, the endochondral bone sequence from the epiphyseal cartilage has reestablished itself. The intact physis is seen at bottom (paraffin-embedded tissue, 1% toluidine blue stain). C: Higher-magnification photomicrograph shows intramembranous woven bone formation, at left, from osteoblasts, which have differentiated from the fibrovascular tissue invasion. Osteoblasts rim the surface of the woven bone (paraffin-embedded section, 1% toluidine blue stain). D: Higher-magnification photomicrograph of tissue response at the upper right region of the medial part of the femoral head showing continuation and/or resumption of endochondral bone formation (paraffin-embedded section, 1% toluidine blue stain).
Fig. 5
Fig. 5
Histologic and magnetic resonance images from a different piglet than that shown in Figures 3 and 4 illustrate other aspects of the common response to ischemia at eight weeks. This response was predominant in six of eight hips followed to eight weeks. A: Photomicrograph of another entire femoral head is shown. Fibrous tissue ingrowth is seen at the lower part of the secondary ossification center laterally above the physis. The cartilage surface is much thicker than normal. Bone in the medial third of the femoral head is relatively normal-appearing endochondral bone, but most bone centrally and in the lateral third is intramembranous bone from the new tissue ingrowth. Tissue from the box at left is shown at higher magnification in B, and tissue from the box at right is shown at higher magnification in C (paraffin-embedded section, hematoxylin and eosin stain). B: The characteristic fibrovascular invasion tissue (*) is seen centrally with large and small blood vessels prominent. Below, cartilage tissue persists, while, above (+), intramembranous bone synthesis from the fibrovascular component has occurred (paraffin-embedded section, hematoxylin and eosin stain). C: Tissue at the upper right showing endochondral bone formation emanating not from a physeal structure but as differentiation with vascularization of preceding cartilage repair tissue. Osteoclasts are prominent in the remodeling repair tissue (paraffin-embedded section, hematoxylin and eosin stain). D: Magnetic resonance imaging along the same plane and orientation as A, highlights the low-signal-intensity tissue (upper arrow), which is dense woven and lamellar intramembranous bone. Immediately below (inferior), the fibrovascular tissue has intermediate signal intensity (lower arrow). Note also the oval shape of the femoral head and its diminished height (T2-weighted sequence). E: Magnetic resonance image at a different depth but still in the coronal plane showing high-signal-intensity (arrow) accumulations, which represent fibrovascular tissue in greater accumulation at this site (T1-weighted sequence after gadolinium enhancement).
Fig. 6
Fig. 6
Figures illustrating magnetic resonance imaging measurements in the involved (ligated) and noninvolved (control) sides analyzed by repeated-measures analysis of variance, with significant group differences denoted by asterisks. The error bars denote 95% confidence intervals. A: Femoral head height. At four weeks, the mean femoral head height was 9.3 mm for the control side and 5.8 mm for the ligated side (mean difference, 3.5 mm; 95% confidence interval for difference, 2.5 to 4.3 mm). At eight weeks, the mean femoral head height was 10.4 mm for the control side and 4.8 mm for the involved side (mean difference, 5.6 mm; 95% confidence interval for difference, 4.7 to 6.5 mm). Therefore, the effect of ligation was an average 3.5-mm reduction at four weeks and a 5.6-mm reduction at eight weeks of follow-up (p < 0.0001). B: Cartilage height, measuring articular cartilage and underlying epiphyseal cartilage. At four weeks, the mean cartilage height was 1.1 mm for the control side and 2.0 mm for the ligated side (mean difference, 0.9 mm; 95% confidence interval for difference, 0.6 to 1.2 mm). At eight weeks, the mean cartilage height was 1.1 mm for the control side and 2.3 mm for the involved side (mean difference, 1.2 mm; 95% confidence interval for difference, 0.8 to 1.5 mm). Thus, the average effect of ligation on cartilage height was an increase of 0.9 mm at four weeks and 1.2 mm at eight weeks of follow-up (p < 0.0001). C: Femoral head diameter. At eight weeks, the mean femoral head diameter was 26.7 mm for the control side and 31.2 mm for the involved side (mean difference, 4.5 mm; 95% confidence interval for difference, 3.2 to 5.6 mm). The effect of ligation was an average increase of 4.5 mm in femoral head diameter (p < 0.0001). D: Femoral neck-shaft angle. At eight weeks, the mean femoral neck-shaft angle was 151° for the control side and 135° for the involved side (mean difference, 16°; 95% confidence interval for difference, 11° to 21°). Therefore, the effect of ligation was a mean reduction of 16° in the femoral neck-shaft angle at eight weeks of follow-up (p < 0.0001).

Similar articles

Cited by

References

    1. Kim HK, Su PH, Qiu YS. Histopathologic changes in growth-plate cartilage following ischemic necrosis of the capital femoral epiphysis. An experimental investigation in immature pigs. J Bone Joint Surg Am. 2001;83:688-97. - PubMed
    1. Kim HK, Su PH. Development of flattening and apparent fragmentation following ischemic necrosis of the capital femoral epiphysis in a piglet model. J Bone Joint Surg Am. 2002;84:1329-34. - PubMed
    1. Jaramillo D, Connolly SA, Vajapeyam S, Robertson RL, Dunning PS, Mulkern RV, Hayward A, Maier SE, Shapiro F. Normal and ischemic epiphysis of the femur: diffusion MR imaging study in piglets. Radiology. 2003;227:825-32. - PubMed
    1. Menezes NM, Connolly SA, Shapiro F, Olear EA, Jimenez RM, Zurakowski D, Jaramillo D. Early ischemia in growing piglet skeleton: MR diffusion and perfusion imaging. Radiology. 2007;242:129-36. - PubMed
    1. Pringle D, Koob TJ, Kim HK. Indentation properties of growing femoral head following ischemic necrosis. J Orthop Res. 2004;22:122-30. - PubMed

Publication types