. 2010 Feb 4;40(3):195-207.
doi: 10.1152/physiolgenomics.00164.2009. Epub 2009 Dec 1.

Global metabolic consequences of the chromogranin A-null model of hypertension: transcriptomic detection, pathway identification, and experimental verification

Affiliations

Global metabolic consequences of the chromogranin A-null model of hypertension: transcriptomic detection, pathway identification, and experimental verification

Ryan S Friese et al. Physiol Genomics. .

Abstract

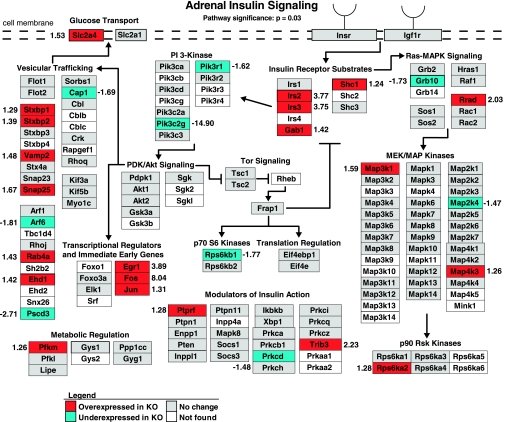
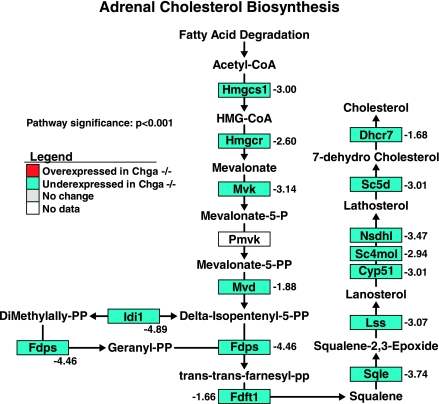
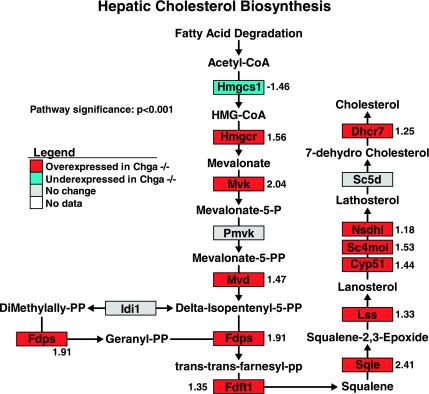
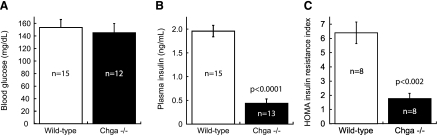
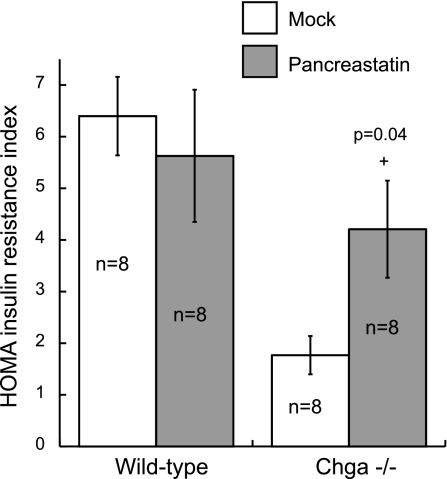
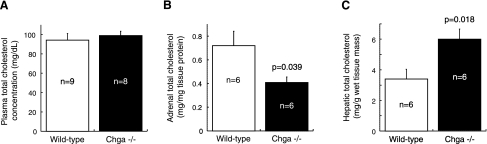
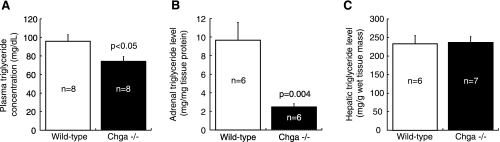
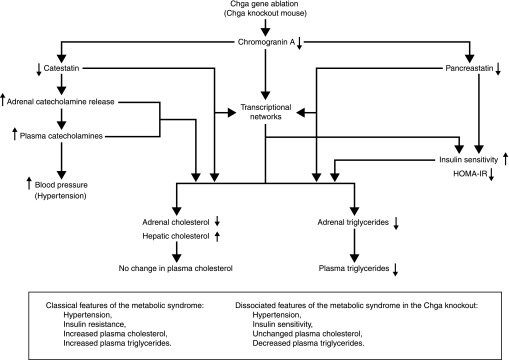
Chromogranin A (CHGA) has a crucial role in formation of regulated secretory granules in neuroendocrine tissues and is also a prohormone that is proteolytically processed into peptides with diverse and complex actions. CHGA and several of its peptide products, including catestatin and pancreastatin, are implicated in pathogenesis of essential hypertension, insulin resistance, and the metabolic syndrome. The Chga knockout mouse (Chga KO) displays severe hypertension coupled with reduction in size, number, and density of regulated secretory granules. We performed genome-wide transcriptome profiling in Chga KO adrenal gland and liver for insight into biochemical and physiological systems altered in this monogenic mouse model of hypertension. Adrenal gene expression pathway prediction of enhanced insulin sensitivity (P = 0.03) in Chga KO was confirmed with glucose, insulin, and homeostasis model assessment of insulin resistance (HOMA-IR) measurements: blood glucose was normal in Chga KO, blood insulin was reduced 4.5-fold (P < 0.0001), and HOMA-IR was decreased 3.8-fold (P < 0.002). Remarkably, such observations conclusively dissociate fundamental features of the metabolic syndrome in this monogenic hypertension model. Exogenous pancreastatin treatment restored insulin sensitivity in the Chga KO to near-normal levels. Gene expression predictions of decreased adrenal cholesterol biosynthesis (P < 0.001) and increased hepatic cholesterol biosynthesis (P < 0.001) were verified with tissue total cholesterol assays: Chga KO adrenal cholesterol decreased 1.8-fold (P = 0.039) and hepatic cholesterol increased 1.8-fold (P = 0.018). Transcriptional regulatory network prediction identified sets of transcription factors that may provide insight into the unclear mechanistic links among CHGA, cholesterol, insulin sensitivity, and the metabolic syndrome. These experiments demonstrate, for the first time, that genetic variation at the CHGA locus impacts insulin sensitivity and tissue cholesterol levels in an intact, living organism. The Chga KO may constitute a unique model for studying the relationship between the CHGA locus and disease phenotypes of the metabolic syndrome.


Figures

Fig. 1.
Fig. 1.
Adrenal insulin signaling and glucose transport gene expression is overexpressed in the chromogranin A (Chga) knockout mouse. Adrenal expression patterns of genes involved in insulin signaling and trans-plasma membrane glucose transport were mapped onto a biochemical pathway diagram with GenMAPP. The overall pattern of expression, specifically, the overexpression of the insulin receptor substrates (Irs2, Irs3, Gab1, Shc1) and primary glucose transporter [Glut4 (Slc2a4)], suggests enhanced insulin signaling and glucose transport in the Chga knockout mouse adrenal gland. Genes overexpressed in the Chga knockout are colored red, genes underexpressed in the Chga knockout are colored blue, genes lacking a statistically significant change are colored gray, and genes without expression data (i.e., the gene lacked a probe on the microarray) are shown in white. Numbers adjacent to genes indicate the fold change of differential expression. A positive number indicates a gene that is overexpressed in the knockout (Chga KO mean signal/wild-type mean signal), and a negative number refers to a gene that is underexpressed in the knockout (−wild-type mean signal/Chga KO mean signal).
Fig. 2.
Fig. 2.
Adrenal cholesterol biosynthesis pathway gene expression is globally underexpressed in the Chga knockout mouse. Adrenal expression patterns of genes involved in cholesterol biosynthesis were mapped onto a biochemical pathway diagram with GenMAPP. The statistically significant and global underexpression of the pathway, including 2.60-fold underexpression of HMG-CoA reductase (Hmgcr), the rate-limiting enzyme in cholesterol biosynthesis, suggests a reduction in de novo cholesterol biosynthesis in the adrenal gland of the Chga knockout mouse. Genes overexpressed in the Chga knockout are colored red, genes underexpressed in the Chga knockout are colored blue, genes lacking a statistically significant change are colored gray, and genes without expression data (i.e., the gene lacked a probe on the microarray) are shown in white. Numbers adjacent to genes indicate the fold change of differential expression. A positive number indicates a gene that is overexpressed in the knockout (Chga KO mean signal/wild-type mean signal), and a negative number refers to a gene that is underexpressed in the knockout (−wild-type mean signal/Chga KO mean signal).
Fig. 3.
Fig. 3.
Hepatic cholesterol biosynthesis pathway gene expression is globally overexpressed in the Chga knockout mouse. Hepatic expression patterns of genes involved in cholesterol biosynthesis were mapped onto a biochemical pathway diagram with GenMAPP. The statistically significant and global overexpression of the pathway, including 1.56-fold overexpression of HMG-CoA reductase (Hmgcr), the rate-limiting enzyme in cholesterol biosynthesis, suggests an increase in de novo cholesterol biosynthesis in the liver of the Chga knockout mouse. Genes overexpressed in the Chga knockout are colored red, genes underexpressed in the Chga knockout are colored blue, genes lacking a statistically significant change are colored gray, and genes without expression data (i.e., the gene lacked a probe on the microarray) are shown in white. Numbers adjacent to genes indicate the fold change of differential expression. A positive number indicates a gene that is overexpressed in the knockout (Chga KO mean signal/wild-type mean signal), and a negative number refers to a gene that is underexpressed in the knockout (−wild-type mean signal/Chga KO mean signal).
Fig. 4.
Fig. 4.
Glucose, insulin, and homeostasis model assessment (HOMA)-insulin resistance (IR) measurements confirm that the Chga knockout mouse is insulin sensitive. A: no difference was detected in blood glucose concentration between wild-type (153.5 ± 12.8 mg/dl) and Chga knockout (Chga−/−) mice (145.3 ± 14.6 mg/dl). B: plasma insulin concentration was reduced 4.5-fold in Chga knockout mice (0.44 ± 0.09 ng/ml) compared with wild-type mice (1.96 ± 0.12 ng/ml). C: the HOMA index of IR in Chga knockout mice (1.7 ± 0.3) was 3.8-fold lower than the HOMA index in wild-type mice (6.4 ± 0.7). Data are presented as means ± SE.
Fig. 5.
Fig. 5.
Acute pancreastatin treatment increases insulin resistance in Chga knockout mice. Wild-type and Chga knockout mice were administered mock (saline) or synthetic pancreastatin peptide (PST) at 40 μg/g body wt via intraperitoneal injection 30 min before determination of the HOMA-IR index. Pancreastatin had no effect on the HOMA index in wild-type mice (6.4 ± 0.7 without PST vs. 5.6 ± 1.3 after PST) but resulted in a 2.5-fold increase in HOMA in Chga knockout mice (1.7 ± 0.3 without PST vs. 4.2 ± 0.9 after PST; +P = 0.04). There was no statistical difference between wild-type mice without PST and Chga knockout mice after PST. Data are presented as means ± SE.
Fig. 6.
Fig. 6.
Confirmation of gene expression predictions: total cholesterol is reduced in the adrenal gland and increased in the liver of the Chga knockout mouse. A: no difference was detected in plasma cholesterol between Chga knockout (99.0 ± 4.4 mg/dl) and wild-type (94.3 ± 6.8 mg/dl) mice. B: adrenal total cholesterol was reduced 1.8-fold in Chga knockout mice (0.41 ± 0.05 mg/mg tissue protein) compared with wild-type mice (0.72 ± 0.12 mg/mg tissue protein). C: hepatic total cholesterol was elevated 1.8-fold in Chga knockout (6.0 ± 0.7 mg/g wet tissue mass) compared with wild-type (3.4 ± 0.6 mg/g wet tissue mass) mice. Data are presented as means ± SE.
Fig. 7.
Fig. 7.
Triglyceride concentration is decreased in the plasma and adrenal gland of the Chga knockout mouse. A: plasma concentration of triglycerides was reduced 1.3-fold in Chga knockout mice (74.3 ± 5.1 mg/dl) compared with wild-type mice (95.9 ± 7.2 mg/dl). B: adrenal triglyceride level was decreased 3.9-fold in Chga knockout mice (2.5 ± 0.3 mg/mg tissue protein) compared with wild-type mice (9.7 ± 1.9 mg/mg tissue protein). C: no difference in hepatic triglyceride level was detected between Chga knockout (236.5 ± 15.9 mg/g wet tissue mass) and wild-type (233.1 ± 22.1 mg/g wet tissue mass) mice. Data are presented as means ± SE.
Fig. 8.
Fig. 8.
Model of global metabolic changes in the Chga knockout mouse. An integrated model to explain how ablation of the Chga gene in the mouse leads to global metabolic changes and dissociation of metabolic syndrome phenotypes is presented. The loss of Chga protein also causes a loss of its bioactive peptides—catestatin and pancreastatin are shown here. Catestatin and pancreastatin are likely to have both genomic (through the PAINT-identified transcriptional networks) and nongenomic effects on metabolism. The effects of lack of catestatin on adrenal catecholamine release, plasma catecholamine levels, and blood pressure were previously demonstrated by Mahapatra et al. (13).

Similar articles

Cited by

References

    1. Cadman PE, Rao F, Mahata SK, O'Connor DT. Studies of the dysglycemic peptide, pancreastatin, using a human forearm model. Ann NY Acad Sci 971: 528–529, 2002 - PubMed
    1. Chen Y, Rao F, Rodriguez-Flores JL, Mahapatra NR, Mahata M, Wen G, Salem RM, Shih PA, Das M, Schork NJ, Ziegler MG, Hamilton BA, Mahata SK, O'Connor DT. Common genetic variants in the chromogranin A promoter alter autonomic activity and blood pressure. Kidney Int 74: 115–125, 2008 - PMC - PubMed
    1. Chen Y, Rao F, Rodriguez-Flores JL, Mahata M, Fung MM, Stridsberg M, Vaingankar SM, Wen G, Salem RM, Das M, Cockburn MG, Schork NJ, Ziegler MG, Hamilton BA, Mahata SK, Taupenot L, O'Connor DT. Naturally occurring human genetic variation in the 3'-untranslated region of the secretory protein chromogranin A is associated with autonomic blood pressure regulation and hypertension in a sex-dependent fashion. J Am Coll Cardiol 52: 1468–1481, 2008 - PMC - PubMed
    1. Dennis G, Jr, Sherman BT, Hosack DA, Yang J, Gao W, Lane HC, Lempicki RA. DAVID: Database for Annotation, Visualization, and Integrated Discovery. Genome Biol 4: P3, 2003 - PubMed
    1. Friese RS, Mahboubi P, Mahapatra NR, Mahata SK, Schork NJ, Schmid-Schoenbein GW, O'Connor DT. Neuroendocrine transcriptome in genetic hypertension: multiple changes in diverse adrenal physiological systems. Hypertension 43: 1301–1311, 2004 - PubMed

Publication types