

Bone lead level prediction models and their application to examine the relationship of lead exposure and hypertension in the Third National Health and Nutrition Examination Survey
- PMID: 19952788
- PMCID: PMC2939477
- DOI: 10.1097/JOM.0b013e3181bf6c8d
Bone lead level prediction models and their application to examine the relationship of lead exposure and hypertension in the Third National Health and Nutrition Examination Survey
Abstract
Objective: We developed prediction models for bone lead using blood lead levels and other standard covariates in a community-based cohort of older men.
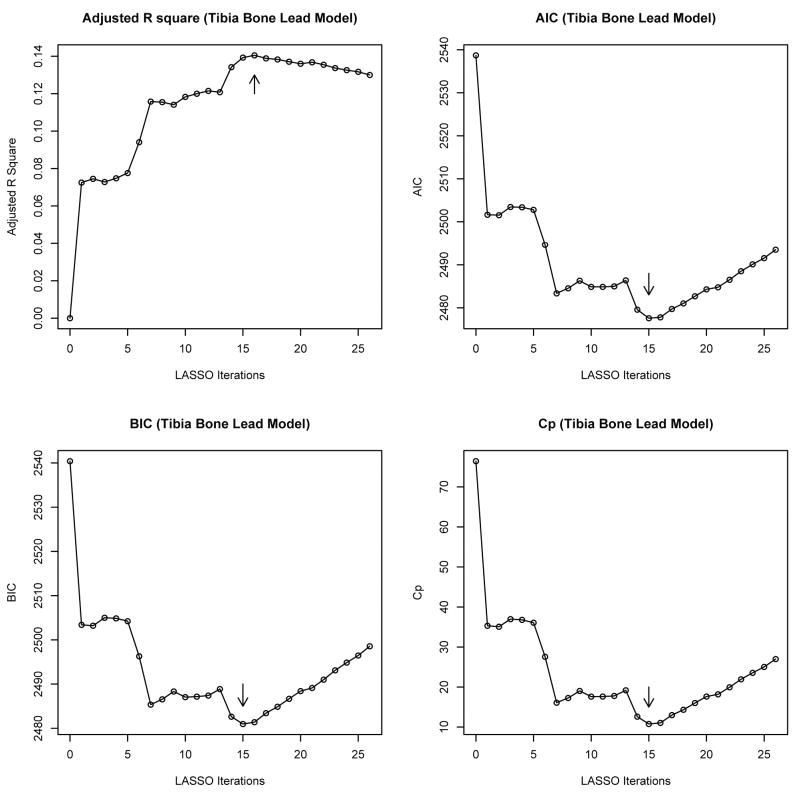
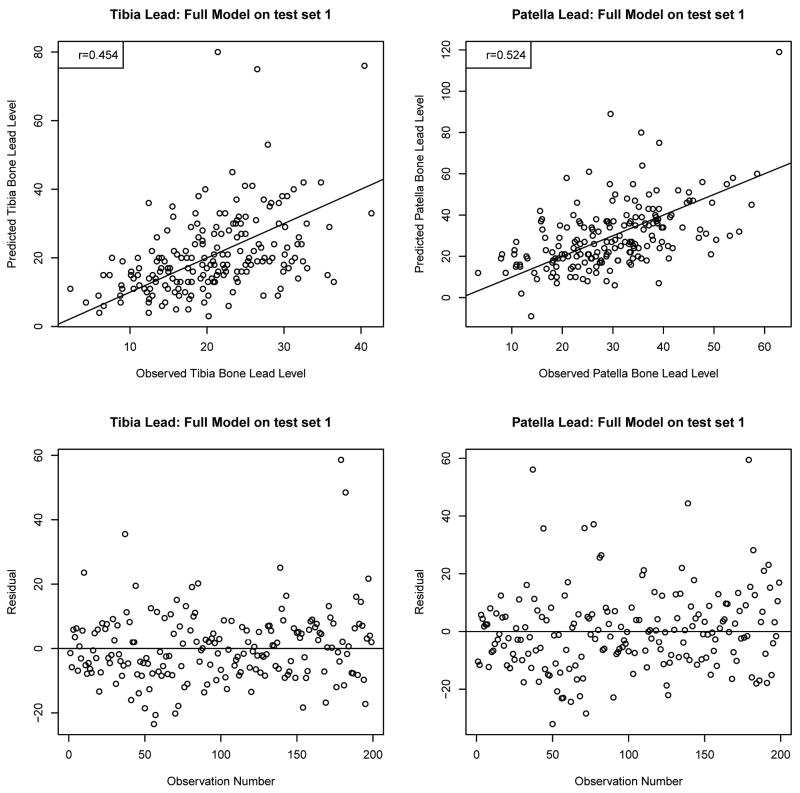
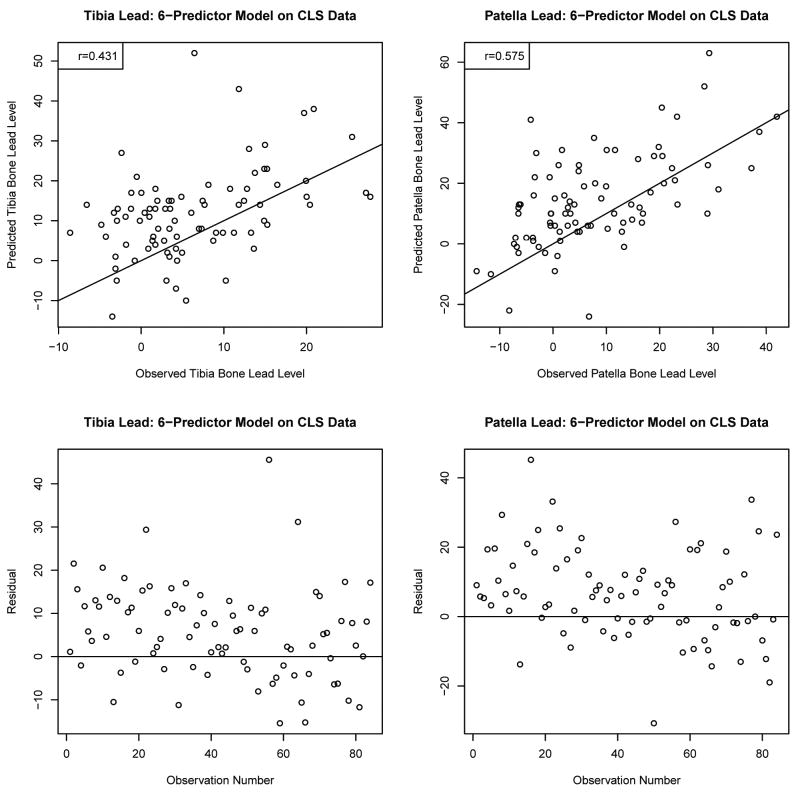
Methods: Participants having bone lead levels measured by K X-ray fluorescence were included in the model selection process (n = 825). Predictors of each tibia and patella lead were identified in three quarters of the population and then predicted the bone lead levels in the remaining one quarter and in the Community Lead Study.
Results: Eighteen predictors were selected for tibia (blood lead, age, education, occupation, smoking status, pack-years of cigarette, serum levels of phosphorus, uric acid, calcium, creatinine and total and high-density lipoprotein cholesterols, hematocrit, body mass index, systolic and diastolic blood pressure, and diagnoses of cancer and diabetes; R2 = 0.32) and 16 for patella lead (among the predictors included in the tibia model diagnosis of cancer, serum levels of calcium, and total cholesterol were not included in patella lead model, but diagnosis of hypertension was included; R2 = 0.34), respectively. The correlation coefficients between the observed and predicted values were 0.43 to 0.50 for tibia and 0.52 to 0.58 for patella lead in internal and external validation. We applied these predicted bone lead models to the Third National Health and Nutrition Examination Survey (NHANES-III) to examine associations with hypertension and found relatively more significant associations compared with blood lead.
Conclusions: This study suggests that the prediction equations may be used to predict bone lead levels in other community-based cohorts with reasonable accuracy.
Figures

Similar articles
-
The relationship of bone and blood lead to hypertension. The Normative Aging Study.JAMA. 1996 Apr 17;275(15):1171-6. JAMA. 1996. PMID: 8609684
-
Determinants of bone and blood lead levels among community-exposed middle-aged to elderly men. The normative aging study.Am J Epidemiol. 1996 Oct 15;144(8):749-59. doi: 10.1093/oxfordjournals.aje.a008999. Am J Epidemiol. 1996. PMID: 8857824
-
Low-Level Cumulative Lead and Resistant Hypertension: A Prospective Study of Men Participating in the Veterans Affairs Normative Aging Study.J Am Heart Assoc. 2018 Nov 6;7(21):e010014. doi: 10.1161/JAHA.118.010014. J Am Heart Assoc. 2018. PMID: 30608198 Free PMC article.
-
Occupational determinants of bone and blood lead levels in middle aged and elderly men from the general community: the Normative Aging Study.Am J Ind Med. 2002 Jul;42(1):38-49. doi: 10.1002/ajim.10078. Am J Ind Med. 2002. PMID: 12111689
-
Relationship of lead in drinking water to bone lead levels twenty years later in Boston men: the Normative Aging Study.J Occup Environ Med. 1999 May;41(5):349-55. doi: 10.1097/00043764-199905000-00002. J Occup Environ Med. 1999. PMID: 10337604 Review.
Cited by
-
Developing a Health Impact Model for Adult Lead Exposure and Cardiovascular Disease Mortality.Environ Health Perspect. 2020 Sep;128(9):97005. doi: 10.1289/EHP6552. Epub 2020 Sep 23. Environ Health Perspect. 2020. PMID: 32965128 Free PMC article.
-
Development of a Cumulative Exposure Index (CEI) for Manganese and Comparison with Bone Manganese and Other Biomarkers of Manganese Exposure.Int J Environ Res Public Health. 2018 Jun 26;15(7):1341. doi: 10.3390/ijerph15071341. Int J Environ Res Public Health. 2018. PMID: 29949870 Free PMC article.
-
Cocaine addiction severity exacerbates the negative association of lifetime lead exposure with blood pressure levels: Evidence from a pilot study.Environ Dis. 2019 Jul-Sep;4(3):75-80. doi: 10.4103/ed.ed_21_19. Epub 2019 Sep 27. Environ Dis. 2019. PMID: 33490759 Free PMC article.
-
Improving prediction of linear regression models by integrating external information from heterogeneous populations: James-Stein estimators.Biometrics. 2024 Jul 1;80(3):ujae072. doi: 10.1093/biomtc/ujae072. Biometrics. 2024. PMID: 39101548 Free PMC article.
-
Blood lead levels among pregnant women: historical versus contemporaneous exposures.Int J Environ Res Public Health. 2010 Apr;7(4):1508-19. doi: 10.3390/ijerph7041508. Epub 2010 Apr 1. Int J Environ Res Public Health. 2010. PMID: 20617043 Free PMC article.
References
-
- Pirkle JL, Brody DJ, Gunter EW, et al. The decline in blood lead levels in the United States. The National Health and Nutrition Examination Surveys (NHANES) JAMA. 1994;272:284–291. - PubMed
-
- Muntner P, Menke A, DeSalvo KB, Rabito FA, Batuman V. Continued decline in blood lead levels among adults in the United States: the National Health and Nutrition Examination Surveys. Arch Intern Med. 2005;165:2155–2161. - PubMed
Publication types
MeSH terms
Substances
Grants and funding
LinkOut - more resources
Full Text Sources
