. 2009:5:332.
doi: 10.1038/msb.2009.90. Epub 2009 Dec 1.

Rapid and sustained nuclear-cytoplasmic ERK oscillations induced by epidermal growth factor

Affiliations

Rapid and sustained nuclear-cytoplasmic ERK oscillations induced by epidermal growth factor

Harish Shankaran et al. Mol Syst Biol. 2009.

Abstract

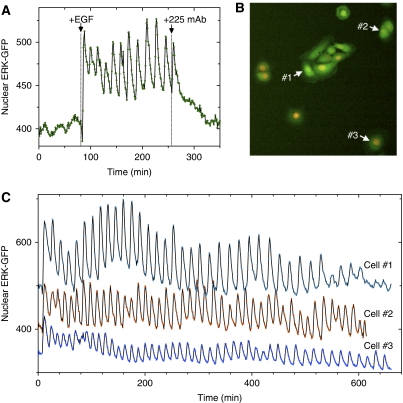
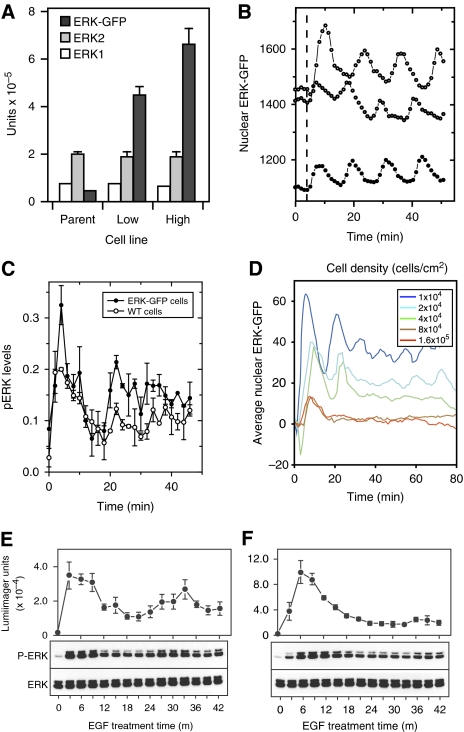
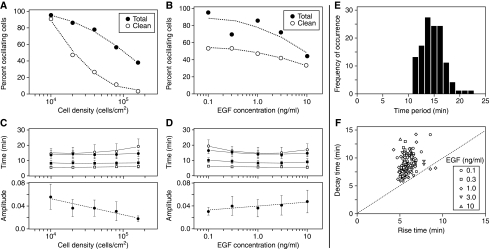
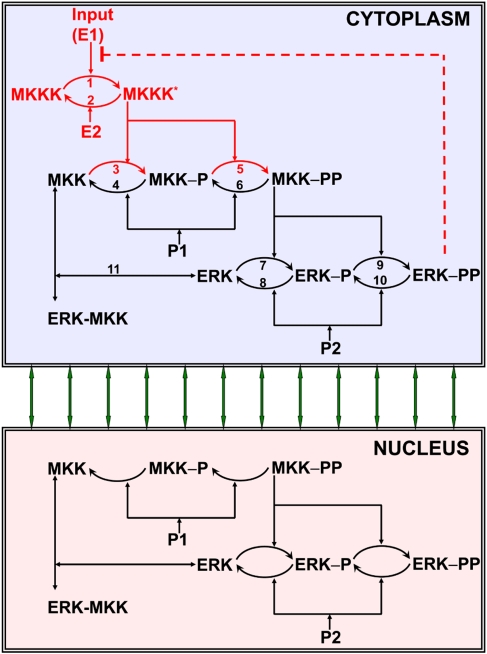
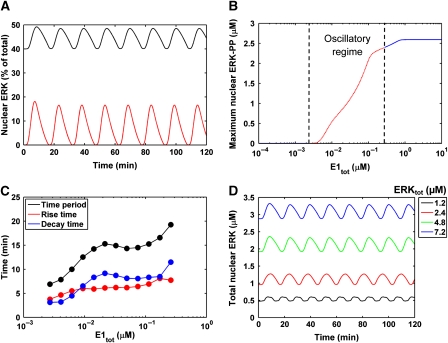
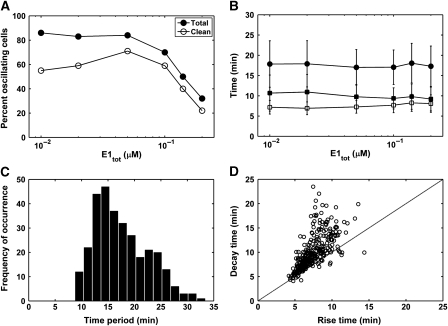
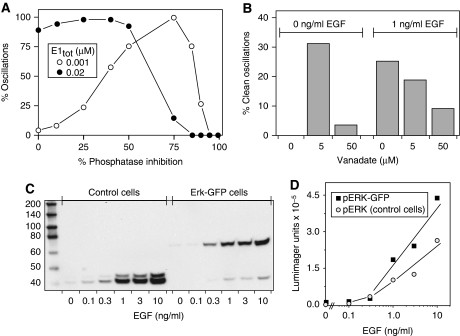
Although the ERK pathway has a central role in the response of cells to growth factors, its regulatory structure and dynamics are incompletely understood. To investigate ERK activation in real time, we expressed an ERK-GFP fusion protein in human mammary epithelial cells. On EGF stimulation, we observed sustained oscillations of the ERK-GFP fusion protein between the nucleus and cytoplasm with a periodicity of approximately 15 min. The oscillations were persistent (>45 cycles), independent of cell cycle phase, and were highly dependent on cell density, essentially disappearing at confluency. Oscillations occurred even at ligand doses that elicited very low levels of ERK phosphorylation, and could be detected biochemically in both transfected and nontransfected cells. Mathematical modeling revealed that negative feedback from phosphorylated ERK to the cascade input was necessary to match the robustness of the oscillation characteristics observed over a broad range of ligand concentrations. Our characterization of single-cell ERK dynamics provides a quantitative foundation for understanding the regulatory structure of this signaling cascade.


Conflict of interest statement

The authors declare that they have no conflict of interest.

Figures

Figure 1
Figure 1
Periodic changes in distribution of ERK–GFP fusion protein in cells after stimulation with EGF. (A) Confocal image of cells expressing ERK–GFP both before and after adding 1 ng/ml EGF for 10 min. Images were taken on a Leica DMRXE Confocal microscope using an HCX PL APO × 63/1.20 NA water immersion lens. (B) Cells expressing both ERK–GFP and mRFPnuc were imaged at 37°C using a × 60 oil immersion objective, and wide-field images were collected simultaneously from the green channel (upper panel) and the red channel (lower panel) at 1-min time intervals. Images after the addition of 1 ng/ml EGF at the times indicated in the upper-right corner are shown. (C) Fluorescence intensities of ERK–GFP fusion protein localized in the nucleus of the images shown in (B) are indicated by the green and blue symbols. Corresponding fluorescence levels of mRFPnuc in the nucleus are indicated by the red and pink symbols. Units are mean pixel intensity of uncorrected images. Arrows indicate correspondence to images shown in panel A. The intensity shift at 11 min was caused by a focus adjustment. Source data is available for this figure at www.nature.com/msb.
Figure 2
Figure 2
ERK oscillations are persistent and require the continuous presence of EGF. (A) Effect of termination of EGF binding on ERK–GFP dynamics. The nuclear level of ERK–GFP fusion protein in a representative cell was followed as described in Figure 1C. EGF (1 ng/ml) was added at the indicated time (84 min). At 255 min, the cells were rinsed twice with EGF-free medium, and 10 μg/ml of the antagonistic anti-EGFR mAb antibody 225 was added to prevent additional ligand binding. (B) Cells expressing both ERK–GFP and mRFPnuc were imaged at 37°C using a × 20 objective. The indicated cells were chosen for analysis because of their varying ERK–GFP expression levels. (C) The fluorescence intensities of ERK–GFP co-localized in the nucleus of the cells indicated in (B) were measured at 1-min intervals continuously for over 10 h. The uncorrected mean pixel intensity levels of nuclear ERK–GFP fusion protein are shown. Source data is available for this figure at www.nature.com/msb.
Figure 3
Figure 3
Effects of ERK–GFP expression levels and cell density on ERK phosphorylation and oscillations. (A) Populations of cells expressing ERK–GFP by retroviral transduction were flow-sorted into groups on the basis of level of expression. Quantification of a western blot of the parent cells and sorted populations expressing the lowest (Low) and higher (High) level of ERK–GFP using an anti-pan-ERK primary antibody is shown. Exposures were kept in the linear range as assessed by serial sample dilution (data not shown) and numbers correspond to the integrated density of the bands corresponding to ERK1, ERK2 and ERK–GFP. (B) Relative levels of nuclear ERK–GFP fusion protein of three cells corresponding to the ‘low' population after stimulation with 1 ng/ml of EGF (at dotted line). The highest, lowest and intermediate ERK–GFP-expressing cell from a single microscope field are shown. Images were taken at 1-min intervals and analyzed as described in Figure 1. (C) Cells corresponding to the ‘low' population and the parental, wild-type (WT) population were plated at a density of ∼2 × 10⁴ cells per cm2 and stimulated with 1 ng/ml of EGF. At 2-min intervals, plates of cells were collected and the level of phosphorylated ERK was determined by ELISA. Error bars represent ±s.d. values of replicate measurements. (D) Profiles were obtained by averaging the responses of individual cells from triplicate fields of cells grown at the indicated cell density. Both oscillating as well as nonoscillating cells were included in the average. For each cell density, the mean nuclear ERK–GFP value before ligand addition was subtracted from the profiles to place them on the same scale. (E) Parental, non-transfected cells were plated at a density of 5 × 10⁴ cells per cm2 and cells were collected at 3-min intervals after addition of 1 ng/ml EGF and processed for western blot analysis. Equal amounts of protein were loaded in each lane and parallel blots were probed for total ERK and phospho-ERK, which were quantified using chemiluminescence. Upper panel is the average result from three biological replicates ±s.e.m. Lower panel is a representative blot from one of the experiments. (F) Same as (C), but using cells plated at a density of 1.1 × 10⁵ cells per cm2. Source data is available for this figure at www.nature.com/msb.
Figure 4
Figure 4
Quantitative analysis of ERK oscillation characteristics of individual cells. (A) Cells were plated at densities ranging from 1–16 × 104 cells per cm2 and treated with 1 ng/ml EGF. Oscillations were followed for at least 10 h at 37°C at 1-min sampling intervals. All individual cells in three random fields were classified as clean, noisy or negative oscillators using waveform analysis (see Supplementary information). (B) Cells were plated at 2 × 10⁴ cells per cm2 and treated with the indicated concentrations of EGF. Oscillations were followed for at least 10 h and classified as described in Supplementary information (see Supplementary Figure S4). (C, D) Effect of (C) cell density and (D) EGF concentration on oscillation waveform characteristics. Top panels present characteristic oscillation times. The time periods of all oscillators (open circles) or of the clean oscillators (closed circles) were determined by Fourier analysis or time domain analysis, respectively. The rise times (open squares) and decay times (closed squares) of the oscillation pulses for the clean oscillators are also shown. Bottom panel presents the normalized oscillation amplitude of the clean oscillators. Values represent mean±s.d. obtained from at least 30 cells. (E) Histogram distribution of time periods of individual cells measured across the entire range of EGF concentrations. (F) Rise and decay times for individual cells measured at various EGF concentrations.
Figure 5
Figure 5
Mathematical model for ERK activation and transport. Species and reactions indicated in red occur only in the cytoplasm, whereas those in black are allowed to occur in both the cytoplasm and the nucleus. Negative feedback from dually phosphorylated ERK to the cascade input is shown as a red dotted line.
Figure 6
Figure 6
Oscillation characteristics for the base parameter set. (A) Total ERK (black) and phospho-ERK (red) profiles in the nucleus at input strength, E1tot=0.02 μM. (B) Maximum nuclear ERK-PP is plotted as a function of E1tot. The dose response in the oscillatory regime is depicted as a red dotted line. (C) Time period, rise and decay time of oscillations are plotted as a function of E1tot. (D) Nuclear ERK profiles are shown for cells expressing different amounts of total cellular ERK at E1tot=0.02 μM. ERK concentrations reported in (B, D) are based on the cytoplasmic volume.
Figure 7
Figure 7
Model predictions for oscillations in a cell population. (A) Percentage of total and clean oscillations in a simulated cell population as a function of the input strength, E1tot. For each value of E1tot, we considered 100 theoretical ‘cells' with inputs and parameters for each cell being sampled from log-normal distributions with a coefficient of variation 0.2. Oscillations with absolute amplitude less than 0.07 μM were deemed to be noisy. (B) Time period (filled circles), rise time (open squares) and decay time (filled squares) are presented as a function of E1tot. Results represent mean±s.d. calculated using the clean oscillators for each E1tot value. (C, D) (C) Histogram distribution of oscillation time periods and rise, (D) decay times of individual cells calculated using all of the clean oscillators across the entire range of E1tot values.
Figure 8
Figure 8
Model validation. (A) Predicted effect of phosphatase inhibition on oscillation percentage at E1tot=0.001 μM and 0.02 μM. For each phosphatase inhibition level, we altered the base parameter set by reducing all phosphatase abundances by the same fractional amount. We generated 100 theoretical ‘cells' with inputs and parameters being distributed log-normally around the chosen input strength and the altered parameter set, respectively, and used bifurcation analysis to determine whether a ‘cell' would oscillate under the imposed input. (B) Experimental measurements of the percentage of clean oscillators in cells pretreated with different concentrations of sodium orthovanadate before addition of either 0 or 1 ng/ml exogenous EGF. Cells were grown to a low density for these experiments, and the fraction of oscillating cells was determined by analyzing at least 15 randomly selected cells under each condition. (C) Parental (control) cells or ERK–GFP-expressing cells from the high expressing population in Figure 3B were grown to a density of 3–4 × 10⁶ cells per cm2 and treated with the indicated concentration of EGF for 5 min at 37°C followed by extraction with detergent as described in Materials and methods section. Equal amounts of protein were loaded on each lane and phosphorylated ERK was visualized using an anti-phosphoERK antibody and chemiluminesce. (D) Quantification of the bands corresponding to ERK2 in the control cells (closed squares) and ERK–GFP fusion protein in the expressing cells (open circles).

Similar articles

Cited by

References

    1. Band V, Sager R (1989) Distinctive traits of normal and tumor-derived human mammary epithelial cells expressed in a medium that supports long-term growth of both cell types. Proc Natl Acad Sci USA 86: 1249–1253 - PMC - PubMed
    1. Barken D, Wang CJ, Kearns J, Cheong R, Hoffmann A, Levchenko A (2005) Comment on ‘Oscillations in NF-kappaB signaling control the dynamics of gene expression'. Science 308: 52; author reply 52 - PMC - PubMed
    1. Bhalla US, Ram PT, Iyengar R (2002) MAP kinase phosphatase as a locus of flexibility in a mitogen-activated protein kinase signaling network. Science 297: 1018–1023 - PubMed
    1. Brightman FA, Fell DA (2000) Differential feedback regulation of the MAPK cascade underlies the quantitative differences in EGF and NGF signalling in PC12 cells. FEBS Lett 482: 169–174 - PubMed
    1. Campbell RE, Tour O, Palmer AE, Steinbach PA, Baird GS, Zacharias DA, Tsien RY (2002) A monomeric red fluorescent protein. Proc Natl Acad Sci USA 99: 7877–7882 - PMC - PubMed

Publication types

Substances