

doi: 10.1364/OL.34.003668.
Spectroscopic phase microscopy for quantifying hemoglobin concentrations in intact red blood cells
Affiliations
- PMID: 19953156
- PMCID: PMC2848941
- DOI: 10.1364/OL.34.003668
Item in Clipboard
Spectroscopic phase microscopy for quantifying hemoglobin concentrations in intact red blood cells
Opt Lett.
.
Abstract
We report a practical method for label-free quantification of specific molecules using spectroscopic imaging of sample-induced phase shifts. Diffraction phase microscopy equipped with various wavelengths of light source is used to record wavelength-dependent phase images. We first perform dispersion measurements on pure solutions of single molecular species present in the cells, such as albumin and hemoglobin (Hb). With this prior calibration of molecular specific dispersion, we demonstrate the extraction of Hb concentration from individual human red blood cells. The end point of this study is noninvasive monitoring of physiological states of intact living cells.
Figures

(Color online) Experimental setup.

(Color online) (a–c) Interferograms of PDMS channel filled with Hb solution. (d–f) Corresponding quantitative phase maps (g) RIs of PDMS, BSA, and water. RIs of water are adopted from Ref. [12]. Inset, the RI difference between BSA solution and water. (h) Measured dispersion of Hb solutions (symbols) and comparison with Ref. [14] (lines). Error bars indicate standard deviations.
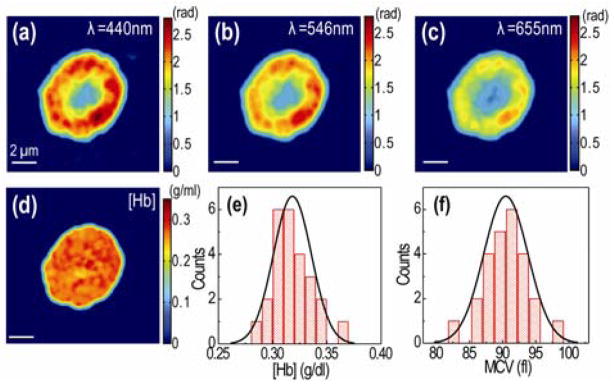
(Color online) (a–c) Quantitative phase maps of a RBC at three different wavelengths. (d) The retrieved Hb concentration. (e) Histogram of Hb concentrations and (f) cell volumes (N=25).
References
-
- Barer R. Determination of dry mass, thickness, solid and water concentration in living cells. Nature. 1953;172:1097–1098. - PubMed
-
- Cuche E, Bevilacqua F, Depeursinge C. Digital holography for quantitative phase-contrast imaging. Opt Lett. 1999;24:291–293. - PubMed
-
- Barty A, Nugent K, Paganin D, Roberts A. Quantitative optical phase microscopy. Optics Letters. 1998;23:817–819. - PubMed
-
- Rylander C, DDP, Akkin T, Milner T, Diller K, Welch A. Quantitative phase-contrast imaging of cells with phase-sensitive optical coherence microscopy. Optics Letters. 2004;29:1509–1511. - PubMed
-
- Popescu G, Ikeda T, Dasari RR, Feld MS. Diffraction phase microscopy for quantifying cell structure and dynamics. Opt Lett. 2006;31:775–777. - PubMed
Publication types
MeSH terms
Substances
Grants and funding
LinkOut - more resources
Full Text Sources
Other Literature Sources
