Randomized Controlled Trial
. 2010 Mar;108(5):935-43.
doi: 10.1007/s00421-009-1301-5. Epub 2009 Dec 2.

Greater amount of visual feedback decreases force variability by reducing force oscillations from 0-1 and 3-7 Hz

Affiliations
Randomized Controlled Trial

Greater amount of visual feedback decreases force variability by reducing force oscillations from 0-1 and 3-7 Hz

Harsimran S Baweja et al. Eur J Appl Physiol. 2010 Mar.

Abstract

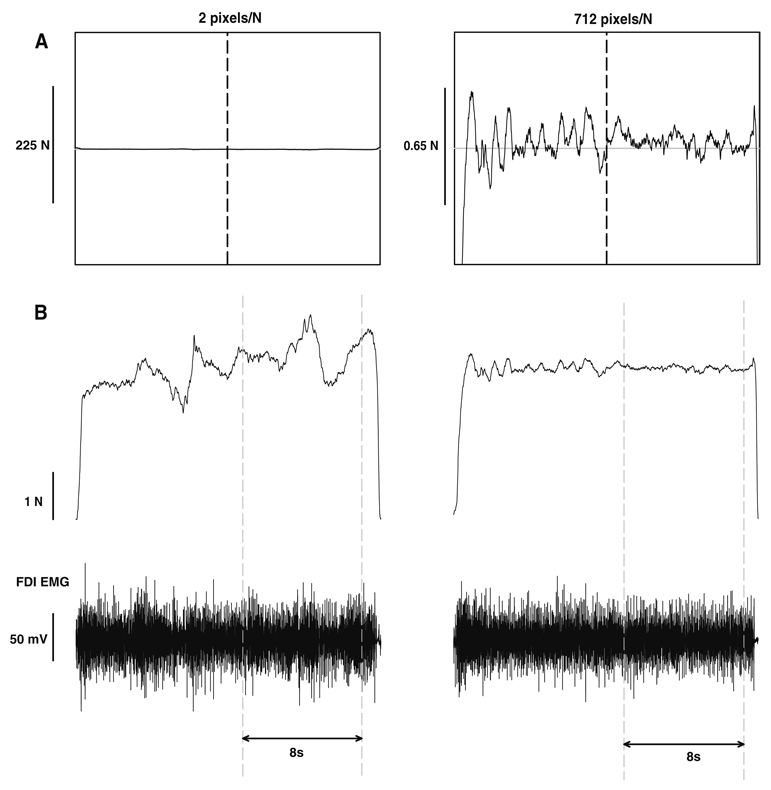
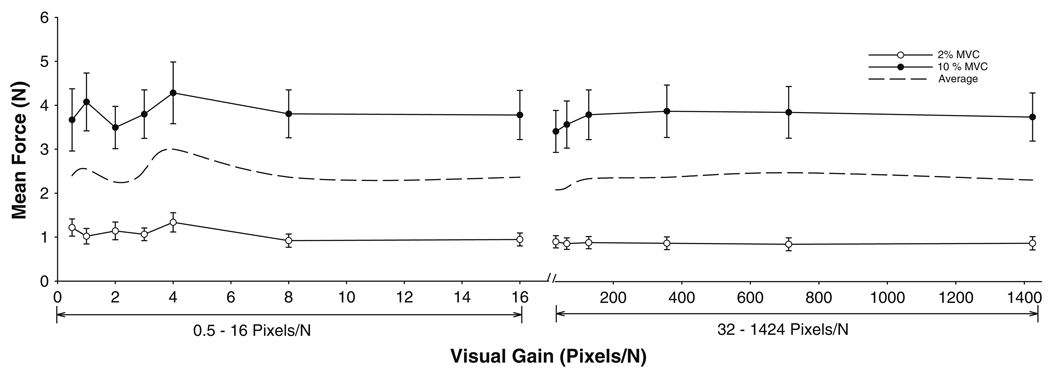
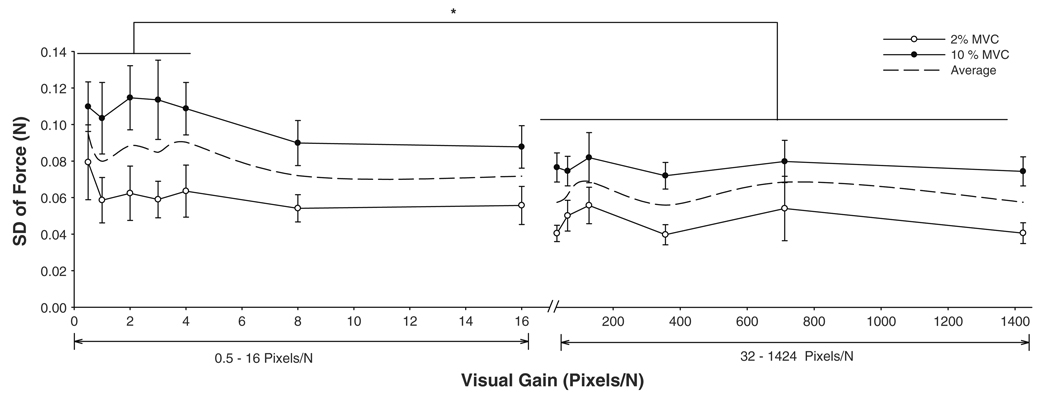
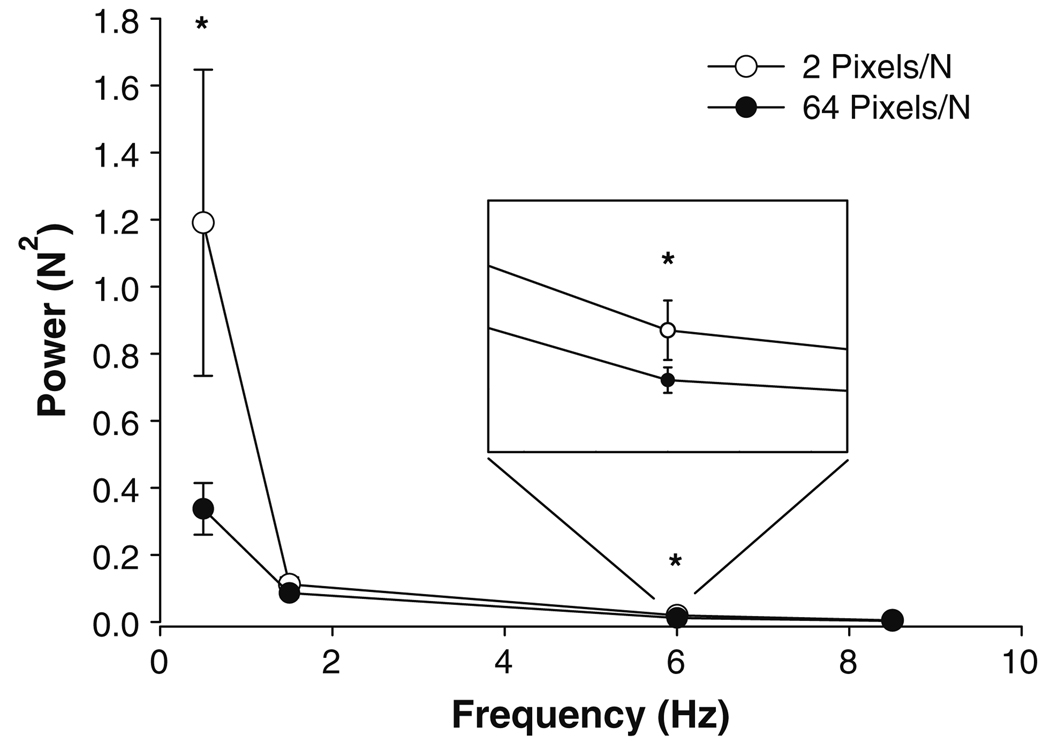
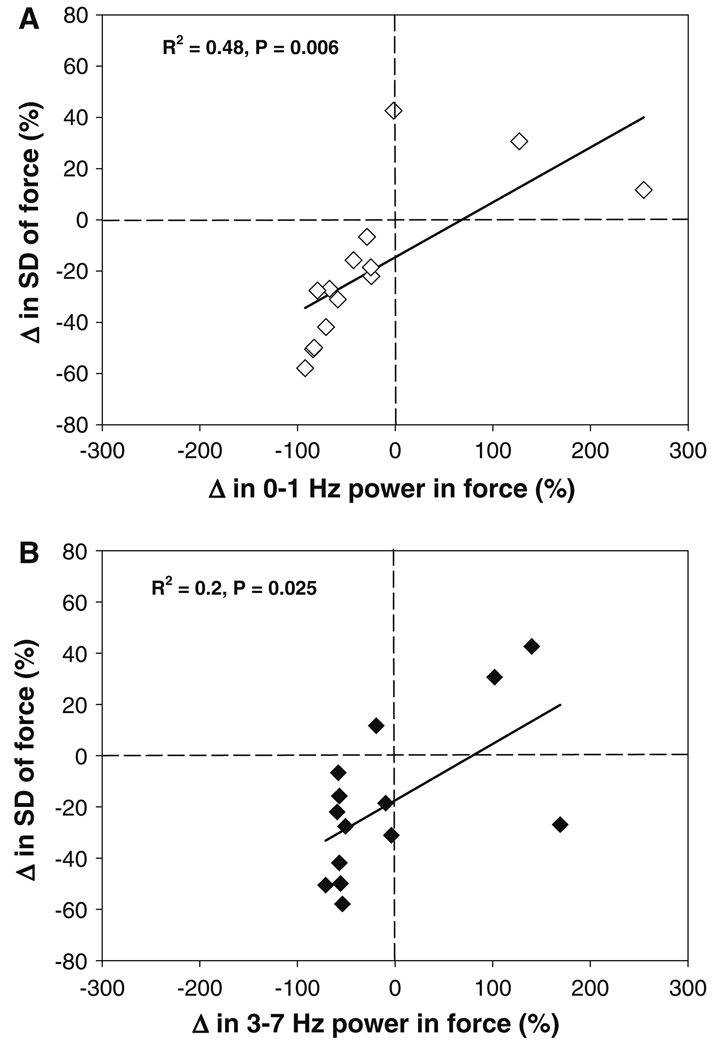
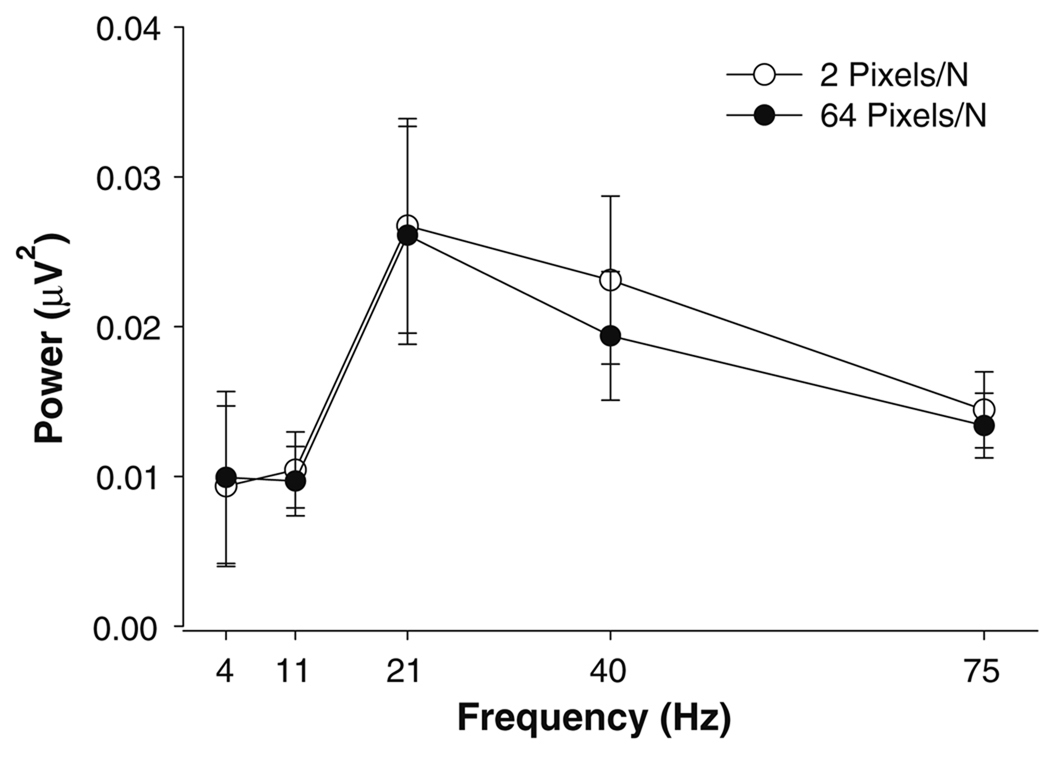
The purpose was to determine the relation between visual feedback gain and variability in force and whether visual gain-induced changes in force variability were associated with frequency-specific force oscillations and changes in the neural activation of the agonist muscle. Fourteen young adults (19-29 years) were instructed to accurately match the target force at 2 and 10% of their maximal voluntary contraction with abduction of the index finger. Force was maintained at specific visual feedback gain levels that varied across trials. Each trial lasted 20 s and the amount of visual feedback was varied by changing the visual gain from 0.5 to 1,474 pixels/N (13 levels; equals approximately 0.001-4.57 degrees ). Force variability was quantified as the standard deviation of the detrended force data. The neural activation of the first dorsal interosseus (FDI) was measured with surface electromyography. The mean force did not vary significantly with the amount of visual feedback. In contrast, force variability decreased from low gains compared to moderate gains (0.5-4 pixels/N: 0.09 +/- 0.04 vs. 64-1,424 pixels/N: 0.06 +/- 0.02 N). The decrease in variability was predicted by a decrease in the power of force oscillations from 0-1 Hz (approximately 50%) and 3-7 Hz (approximately 20%). The activity of the FDI muscle did not vary across the visual feedback gains. These findings demonstrate that in young adults force variability can be decreased with increased visual feedback gain (>64 pixels/N vs. 0.5-4 pixels/N) due to a decrease in the power of oscillations in the force from 0-1 and 3-7 Hz.


Figures

Fig. 1
Fig. 1
Constant isometric force task with the FDI muscle. Each subject was instructed to exert a force with abduction of the index finger against a force transducer and match the horizontal target line for 20 s. The subjects were asked to match the target accurately and consistently for the last 10 s of each trial marked by the vertical black line in the center of the screen at 10 s. a Representative trial from one subject when exerting a constant isometric force at 10% MVC with a visual feedback gain of 2 pixels/N (left column) and 64 pixels/N (right column). b The force and EMG analysis was based on the selected segment of each trial. The top row represents the force trace for the trials represented in a and the bottom row is the corresponding FDI EMG activity. The analysis was performed from 11 to 19 s on each trial
Fig. 2
Fig. 2
Mean force as a function of visual feedback gains. The mean force was similar across the feedback gains for 2% (open circles) and 10% (filled circles) MVC. The dashed line is the averaged function of the two forces, indicating that the mean force was not significantly different across the 13 visual gains
Fig. 3
Fig. 3
Force variability as a function of visual feedback gains. The SD of force was lower at 2% MVC (open circles) compared with 10% MVC (filled circles). On average, it was higher (asterisk) at smaller visual gains (0.5–4 pixels/N) compared with greater visual gains (32–1,424 pixels/N). The dashed line is the averaged function of the two forces, indicating the decrease of force variability after 32 pixels/N across the 13 visual gains
Fig. 4
Fig. 4
Power spectrum of the force output. The force spectrum was analyzed from 0–1, 1–3, 3–7, and 7–10 Hz bins. The x-axis is presented as the mean frequency of each band (0.5, 2, 5, and 8.5 Hz). Although the overall shape of the power spectrum was similar for 2 pixels/N (open circles) and 64 pixels/N (filled circles), there was a significant difference between the visual gains at 0–1 and 3–7 Hz (asterisk). Specifically, the higher visual gain (64 pixels/N) decreased power from 0–1 and 3–7 Hz (inset) compared with the lower visual gain (2 pixels/N)
Fig. 5
Fig. 5
Prediction of the change in SD of force. The decrease in SD of force with greater visual gain was associated with a decrease in power from 0–1 and 3–7 Hz. a The change of power from 0–1 Hz in the force power spectrum predicted the change in the SD of force. The relation indicates that modulation of force at 0–1 Hz accounted for ~48% of the decrease in the variability of force (R2 = 0.48, P = 0.006). b The change of power from 3–7 Hz in the force power spectrum predicted the change in the SD of force. The relation indicates that modulation of force at 3–7 Hz accounted for ~20% of the decrease in the variability of force (R2 = 0.2, P = 0.025)
Fig. 6
Fig. 6
Power spectrum of FDI EMG. The EMG power spectrum was analyzed from 0–7, 7–13, 13–30, 30–50, and 50–100 Hz bins. Although the EMG power spectrum varied with frequency, the structure of the FDI EMG was similar at 2 pixels/N (open circles) and 64 pixels/N (closed circles). No significant differences were observed between the two gains

References

    1. Baweja HS, Kennedy DM, Vu JL, Vaillancourt DE, Christou EA. Greater amounts of visual feedback alters muscle activity and reduce force variability during constant isometric contractions. Chicago, IL: Society for Neuroscience; 2009a. - PMC - PubMed
    1. Baweja HS, Patel BK, Martinkewiz JD, Vu J, Christou EA. Removal of visual feedback alters muscle activity and reduces force variability during constant isometric contractions. Exp Brain Res. 2009b;197:35–47. - PMC - PubMed
    1. Brown P. Cortical drives to human muscle: the Piper and related rhythms. Prog Neurobiol. 2000;60:97–108. - PubMed
    1. Chao EYS, An KN, Cooney WP, Linschied RL. Biomechanics of the hand. A basic research study. Teaneck: World Scientific Publishing; 1989.
    1. Christou EA. Visual feedback attenuates force fluctuations induced by a stressor. Med Sci Sports Exerc. 2005;37:2126–2133. - PubMed

Publication types

LinkOut - more resources