

Arterial transit time effects in pulsed arterial spin labeling CBF mapping: insight from a PET and MR study in normal human subjects
- PMID: 19953506
- PMCID: PMC2867043
- DOI: 10.1002/mrm.22218
Arterial transit time effects in pulsed arterial spin labeling CBF mapping: insight from a PET and MR study in normal human subjects
Abstract
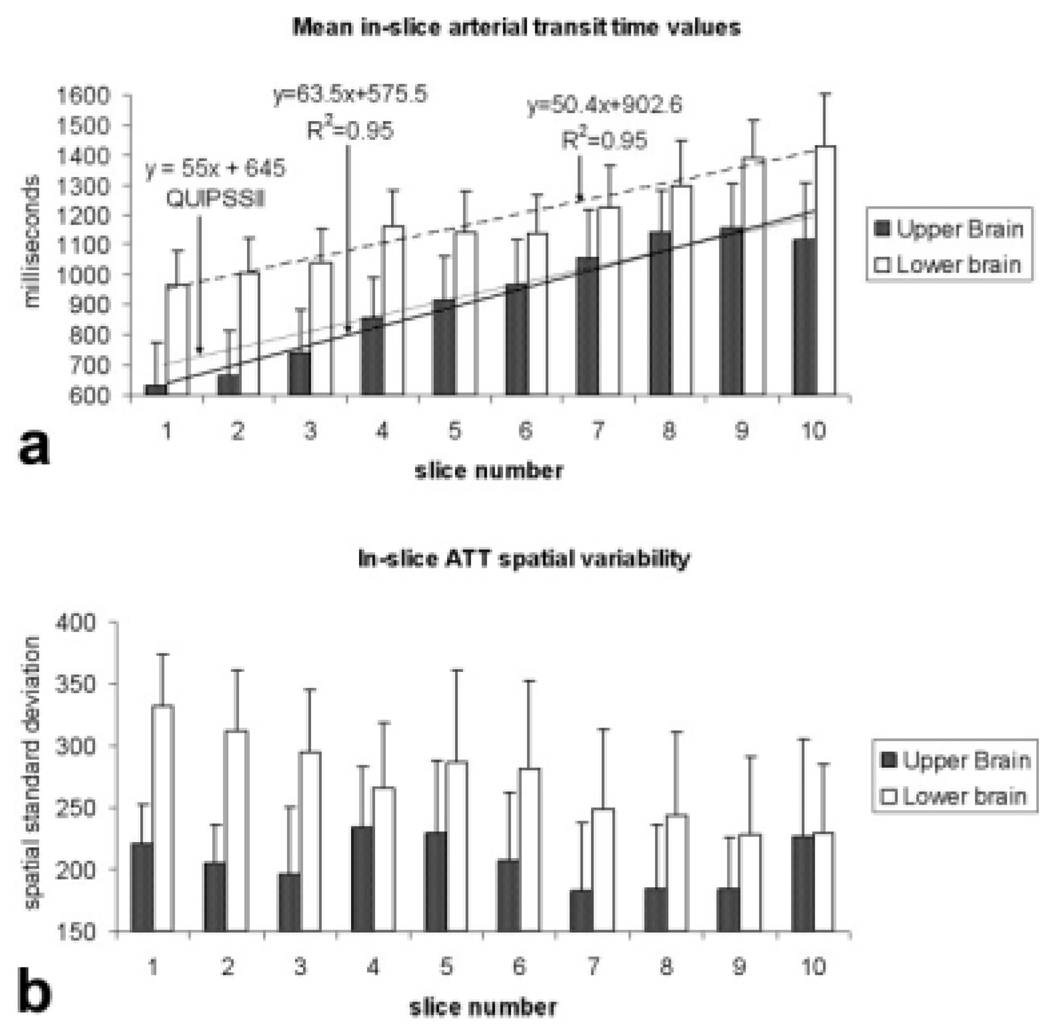
Arterial transit time (ATT), a key parameter required to calculate absolute cerebral blood flow in arterial spin labeling (ASL), is subject to much uncertainty. In this study, ASL ATTs were estimated on a per-voxel basis using data measured by both ASL and positron emission tomography in the same subjects. The mean ATT increased by 260 +/- 20 (standard error of the mean) ms when the imaging slab shifted downwards by 54 mm, and increased from 630 +/- 30 to 1220 +/- 30 ms for the first slice, with an increase of 610 +/- 20 ms over a four-slice slab when the gap between the imaging and labeling slab increased from 20 to 74 mm. When the per-slice ATTs were employed in ASL cerebral blood flow quantification and the in-slice ATT variations ignored, regional cerebral blood flow could be significantly different from the positron emission tomography measures. ATT also decreased with focal activation by the same amount for both visual and motor tasks (approximately 80 ms). These results provide a quantitative relationship between ATT and the ASL imaging geometry and yield an assessment of the assumptions commonly used in ASL imaging. These findings should be considered in the interpretation of, and comparisons between, different ASL-based cerebral blood flow studies. The results also provide spatially specific ATT data that may aid in optimizing the ASL imaging parameters.
Figures


References
-
- Lipton ML, Branch CA, Hrabe J, Lewis DP, Helpern JA. RF excitation profiles with FAIR: impact of truncation of the arterial input function on quantitative perfusion. J Magn Reson Imaging. 2001;13:207–214. - PubMed
-
- Yongbi MN, Yang Y, Frank JA, Duyn JH. Multislice perfusion imaging in human brain using the C-FOCI inversion pulse: comparison with hyperbolic secant. Magn Reson Med. 1999;42:1098–1105. - PubMed
-
- Zhan W, Gu H, Silbersweig DA, Stern E, Yang Y. Inversion profiles of adiabatic inversion pulses for flowing spins: the effects on labeling efficiency and labeling accuracy in perfusion imaging with pulsed arterial spin-labeling. Magn Reson Imaging. 2002;20:487–494. - PubMed
-
- Frank LR, Wong EC, Buxton RB. Slice profile effects in adiabatic inversion: application to multislice perfusion imaging. Magn Reson Med. 1997;38:558–564. - PubMed
Publication types
MeSH terms
Substances
Grants and funding
LinkOut - more resources
Full Text Sources
Other Literature Sources
Medical
Miscellaneous
